
Advertisement
Warren Buffett famously said, 'Volatility is far from synonymous with risk.' When we think about how risky a company is, we always like to look at its use of debt, since debt overload can lead to ruin. As with many other companies Mizuno Corporation (TSE:8022) makes use of debt. But is this debt a concern to shareholders?
Why Does Debt Bring Risk?
Debt and other liabilities become risky for a business when it cannot easily fulfill those obligations, either with free cash flow or by raising capital at an attractive price. Ultimately, if the company can't fulfill its legal obligations to repay debt, shareholders could walk away with nothing. However, a more common (but still painful) scenario is that it has to raise new equity capital at a low price, thus permanently diluting shareholders. By replacing dilution, though, debt can be an extremely good tool for businesses that need capital to invest in growth at high rates of return. The first step when considering a company's debt levels is to consider its cash and debt together.
View our latest analysis for Mizuno
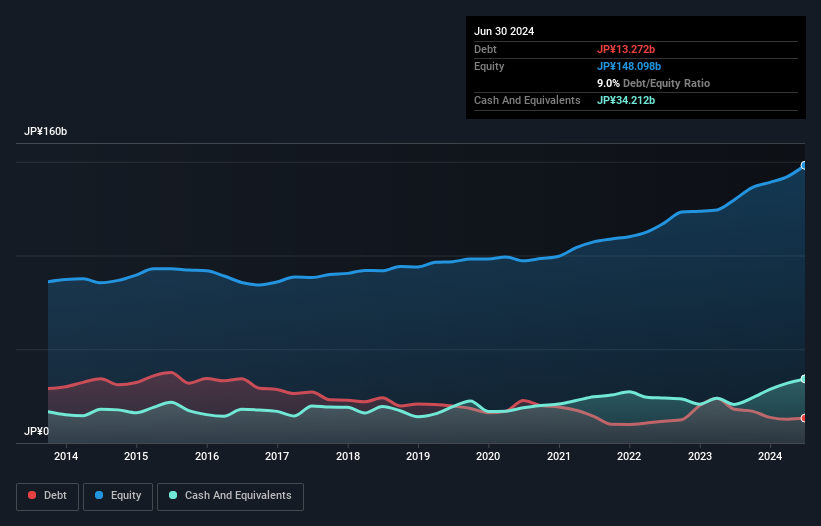
How Much Debt Does Mizuno Carry?
As you can see below, Mizuno had JP¥13.3b of debt at June 2024, down from JP¥18.0b a year prior. However, its balance sheet shows it holds JP¥34.2b in cash, so it actually has JP¥20.9b net cash.
A Look At Mizuno's Liabilities
We can see from the most recent balance sheet that Mizuno had liabilities of JP¥38.7b falling due within a year, and liabilities of JP¥18.7b due beyond that. On the other hand, it had cash of JP¥34.2b and JP¥46.2b worth of receivables due within a year. So it can boast JP¥23.1b more liquid assets than total liabilities.
This surplus suggests that Mizuno has a conservative balance sheet, and could probably eliminate its debt without much difficulty. Succinctly put, Mizuno boasts net cash, so it's fair to say it does not have a heavy debt load!
Also positive, Mizuno grew its EBIT by 27% in the last year, and that should make it easier to pay down debt, going forward. The balance sheet is clearly the area to focus on when you are analysing debt. But it is future earnings, more than anything, that will determine Mizuno's ability to maintain a healthy balance sheet going forward. So if you want to see what the professionals think, you might find this free report on analyst profit forecasts to be interesting.
But our final consideration is also important, because a company cannot pay debt with paper profits; it needs cold hard cash. While Mizuno has net cash on its balance sheet, it's still worth taking a look at its ability to convert earnings before interest and tax (EBIT) to free cash flow, to help us understand how quickly it is building (or eroding) that cash balance. Looking at the most recent three years, Mizuno recorded free cash flow of 31% of its EBIT, which is weaker than we'd expect. That weak cash conversion makes it more difficult to handle indebtedness.
Summing Up
While we empathize with investors who find debt concerning, you should keep in mind that Mizuno has net cash of JP¥20.9b, as well as more liquid assets than liabilities. And we liked the look of last year's 27% year-on-year EBIT growth. So is Mizuno's debt a risk? It doesn't seem so to us. When analysing debt levels, the balance sheet is the obvious place to start. But ultimately, every company can contain risks that exist outside of the balance sheet. These risks can be hard to spot. Every company has them, and we've spotted 1 warning sign for Mizuno you should know about.
Of course, if you're the type of investor who prefers buying stocks without the burden of debt, then don't hesitate to discover our exclusive list of net cash growth stocks, today.
New: Manage All Your Stock Portfolios in One Place
We've created the ultimate portfolio companion for stock investors, and it's free.
• Connect an unlimited number of Portfolios and see your total in one currency
• Be alerted to new Warning Signs or Risks via email or mobile
• Track the Fair Value of your stocks
Have feedback on this article? Concerned about the content? Get in touch with us directly. Alternatively, email editorial-team (at) simplywallst.com.
This article by Simply Wall St is general in nature. We provide commentary based on historical data and analyst forecasts only using an unbiased methodology and our articles are not intended to be financial advice. It does not constitute a recommendation to buy or sell any stock, and does not take account of your objectives, or your financial situation. We aim to bring you long-term focused analysis driven by fundamental data. Note that our analysis may not factor in the latest price-sensitive company announcements or qualitative material. Simply Wall St has no position in any stocks mentioned.
About TSE:8022
Mizuno
Manufactures and sells sports products in Japan, the rest of Asia, Europe, the Americas, and Oceania.
Flawless balance sheet, undervalued and pays a dividend.
Similar Companies
Market Insights

Advertisement
Community Narratives
MicroVision will explode future revenue by 380.37% with a vision towards success
Fair Value US$60|98.4% undervalued
TH
Community Contributor
The Indispensable Artery for a New North American Economy
Fair Value CA$132.87|0.6% undervalued
TI
Community Contributor
Recently Updated Narratives
BL


BlackGoat on Alphabet ·
Alphabet: The Under-appreciated Compounder Hiding in Plain Sight
Fair Value:US$324.481.3% undervalued
75 followersusers have followed this narrative
3 commentsusers have commented on this narrative
1 likeusers have liked this narrative
BE


Bejgal on MINISO Group Holding ·
MINISO's fair value is projected at 26.69 with an anticipated PE ratio shift of 20x
Fair Value:US$26.6926.7% undervalued
44 followersusers have followed this narrative
3 commentsusers have commented on this narrative
0 likesusers have liked this narrative
TI


TickerTickle on Oracle ·
The Quiet Giant That Became AI’s Power Grid
Fair Value:US$389.8147.4% undervalued
9 followersusers have followed this narrative
1 commentusers have commented on this narrative
0 likesusers have liked this narrative
Popular Narratives
OS

oscargarcia on Alphabet ·
The company that turned a verb into a global necessity and basically runs the modern internet, digital ads, smartphones, maps, and AI.
Fair Value:US$3405.9% undervalued
136 followersusers have followed this narrative
6 commentsusers have commented on this narrative
18 likesusers have liked this narrative
TH

TheWallstreetKing on MicroVision ·
MicroVision will explode future revenue by 380.37% with a vision towards success
Fair Value:US$6098.4% undervalued
89 followersusers have followed this narrative
11 commentsusers have commented on this narrative
18 likesusers have liked this narrative
AN


AnalystConsensusTarget on NVIDIA ·
NVDA: Expanding AI Demand Will Drive Major Data Center Investments Through 2026
Fair Value:US$232.7922.6% undervalued
926 followersusers have followed this narrative
6 commentsusers have commented on this narrative
22 likesusers have liked this narrative