Advertisement
YONEX (TSE:7906) – Examining Valuation After Strong Shareholder Returns and Ongoing Momentum

Simply Wall St
Reviewed by Simply Wall St
YONEX (TSE:7906) shares have recently caught the eye of investors, especially given their impressive returns over the past year and continued upward momentum this quarter. Investors are now watching closely to see how current trends will shape further gains.
See our latest analysis for YONEX.
With the share price recently hitting ¥3,950 and momentum showing no signs of fading, YONEX has seen confidence build around its growth story. The stock’s one-year total shareholder return of nearly 98% and a remarkable 615% five-year total return highlight both strong recent performance and impressive long-term value creation.
If you’re inspired by YONEX’s run, now might be the perfect time to broaden your investing approach and discover fast growing stocks with high insider ownership
With such impressive returns and continued momentum, the key question for investors now is whether YONEX remains undervalued or if the market is already pricing in all of its future growth potential. Is there still a buying opportunity?
Price-to-Earnings of 28.1x: Is it justified?
YONEX is currently trading at a price-to-earnings (P/E) ratio of 28.1x, which stands well above both the industry average and its estimated fair value. The last close price of ¥3,950 suggests investors are paying a premium for each yen of recent earnings.
The price-to-earnings ratio compares a company’s current share price to its per-share earnings. It is an essential measure for evaluating how much investors are willing to pay for future earnings growth. For companies in the leisure segment, it often signals the market’s optimism about growth potential and profitability.
Despite robust earnings growth and high-quality recent profits, YONEX’s P/E ratio of 28.1x appears expensive not just relative to the broader JP Leisure industry average of 15.1x, but also compared to its own fair P/E estimate of 18x. The market is clearly factoring in expectations for YONEX to deliver superior performance ahead. However, this premium leaves little margin for error if growth slows.
Explore the SWS fair ratio for YONEX
Result: Price-to-Earnings of 28.1x (OVERVALUED)
However, a shift in market sentiment or a slowdown in earnings growth could quickly challenge the optimism that is currently fueling YONEX’s strong share price.
Find out about the key risks to this YONEX narrative.
Another View: Discounted Cash Flow Perspective
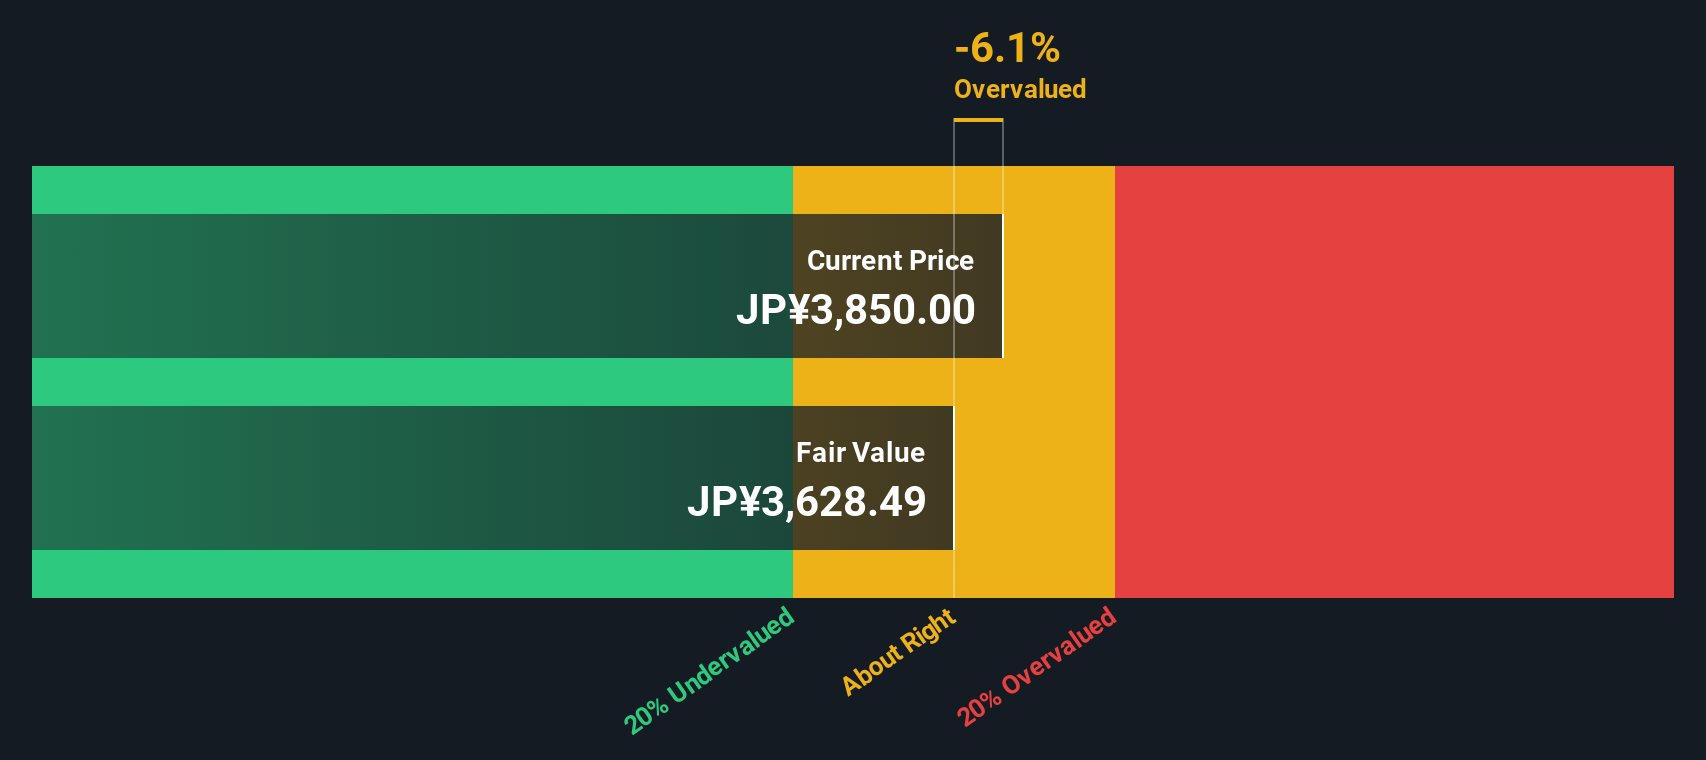
Taking a different approach, the SWS DCF model estimates YONEX's fair value at ¥3,814 per share. This value is lower than the current trading price of ¥3,950, suggesting a moderate premium to intrinsic value and calling recent enthusiasm into question. Does this mean excitement in the market has gone a little too far, or is there something bigger at play?
Look into how the SWS DCF model arrives at its fair value.
Simply Wall St performs a discounted cash flow (DCF) on every stock in the world every day (check out YONEX for example). We show the entire calculation in full. You can track the result in your watchlist or portfolio and be alerted when this changes, or use our stock screener to discover undervalued stocks based on their cash flows. If you save a screener we even alert you when new companies match - so you never miss a potential opportunity.
Build Your Own YONEX Narrative
If you have your own perspective or want to dig deeper into the data, it's easy to shape your own investment narrative in just a few minutes, so Do it your way.
A great starting point for your YONEX research is our analysis highlighting 2 key rewards and 1 important warning sign that could impact your investment decision.
Looking for more investment ideas?
Don’t miss out on the next wave of winners. Use the Simply Wall Street Screener to spot bold new opportunities beyond YONEX before they go mainstream.
- Capture promising price swings and untapped growth by checking out these 3556 penny stocks with strong financials making moves in the market’s spotlight.
- Snag reliable income streams with these 17 dividend stocks with yields > 3% for attractive yields backed by strong fundamentals.
- Jump ahead of the curve with these 27 AI penny stocks as they power advances across industries with the latest artificial intelligence breakthroughs.
This article by Simply Wall St is general in nature. We provide commentary based on historical data and analyst forecasts only using an unbiased methodology and our articles are not intended to be financial advice. It does not constitute a recommendation to buy or sell any stock, and does not take account of your objectives, or your financial situation. We aim to bring you long-term focused analysis driven by fundamental data. Note that our analysis may not factor in the latest price-sensitive company announcements or qualitative material. Simply Wall St has no position in any stocks mentioned.
New: Manage All Your Stock Portfolios in One Place
We've created the ultimate portfolio companion for stock investors, and it's free.
• Connect an unlimited number of Portfolios and see your total in one currency
• Be alerted to new Warning Signs or Risks via email or mobile
• Track the Fair Value of your stocks
Have feedback on this article? Concerned about the content? Get in touch with us directly. Alternatively, email editorial-team@simplywallst.com
About TSE:7906
Excellent balance sheet with proven track record.
Similar Companies
Market Insights

Advertisement
Community Narratives
Finding The True Value Of A Logistics Powerhouse
Fair Value US$95.21|8.4% undervalued
NV
Community Contributor
Paradigm Biopharmaceuticals Will Lead Osteoarthritis Treatment with Zilosul's FDA Success
Fair Value AU$5.50|91.9% undervalued
AM
Community Contributor
Barrick Mining (ABX:CA): A Gold Hedge against a U.S. Shutdown
Fair Value CA$60.00|24.2% undervalued
GM
Community Contributor