Advertisement
YONEX (TSE:7906): Evaluating Valuation as Shares Extend Multi-Year Winning Streak

Simply Wall St
Reviewed by Kshitija Bhandaru
YONEX (TSE:7906) has caught fresh attention from investors after shares edged up just over 1% in today’s session. Recent trading hints at renewed curiosity about how the stock is valued, particularly given recent trends in the sports equipment industry.
See our latest analysis for YONEX.
Momentum has been strong for YONEX, with its share price up nearly 80% year-to-date and an impressive 85% total shareholder return over the last twelve months. Following a surge fueled by optimism in the sports equipment sector, investors now appear to be recalibrating expectations and considering long-term prospects as the stock continues its multi-year winning streak.
If you’re interested in finding more companies with remarkable momentum and insider confidence, now’s a great time to explore fast growing stocks with high insider ownership.
With share prices nearing record highs and healthy earnings growth, investors are weighing whether YONEX remains undervalued or if the recent surge means that future performance has already been priced in, which could leave little room for upside.
Price-to-Earnings of 27.2x: Is it justified?
YONEX trades at a price-to-earnings (P/E) ratio of 27.2x, significantly higher than both its own estimated fair P/E and the average for industry peers. This suggests the stock may be priced for aggressive future growth.
The P/E ratio reflects how much investors are willing to pay today for a single yen of current earnings. For a sports equipment leader like YONEX, this multiple often signals expectations that profits will continue to rise at a healthy rate. However, the current P/E is much higher than both the industry average and our estimated fair value. This typically implies investors expect exceptional performance well into the future.
Compared to the Japanese Leisure industry average of 14.9x and a fair P/E of 17.9x, the 27.2x multiple stands out as an outlier. If the stock's growth slows or the sector cycle changes, the market could reassess how much it is willing to pay for these earnings.
Explore the SWS fair ratio for YONEX
Result: Price-to-Earnings of 27.2x (OVERVALUED)
However, if sector sentiment sours or revenue growth stalls, YONEX’s elevated valuation could face swift market pressure and potential downside risk.
Find out about the key risks to this YONEX narrative.
Another View: SWS DCF Model Weighs In
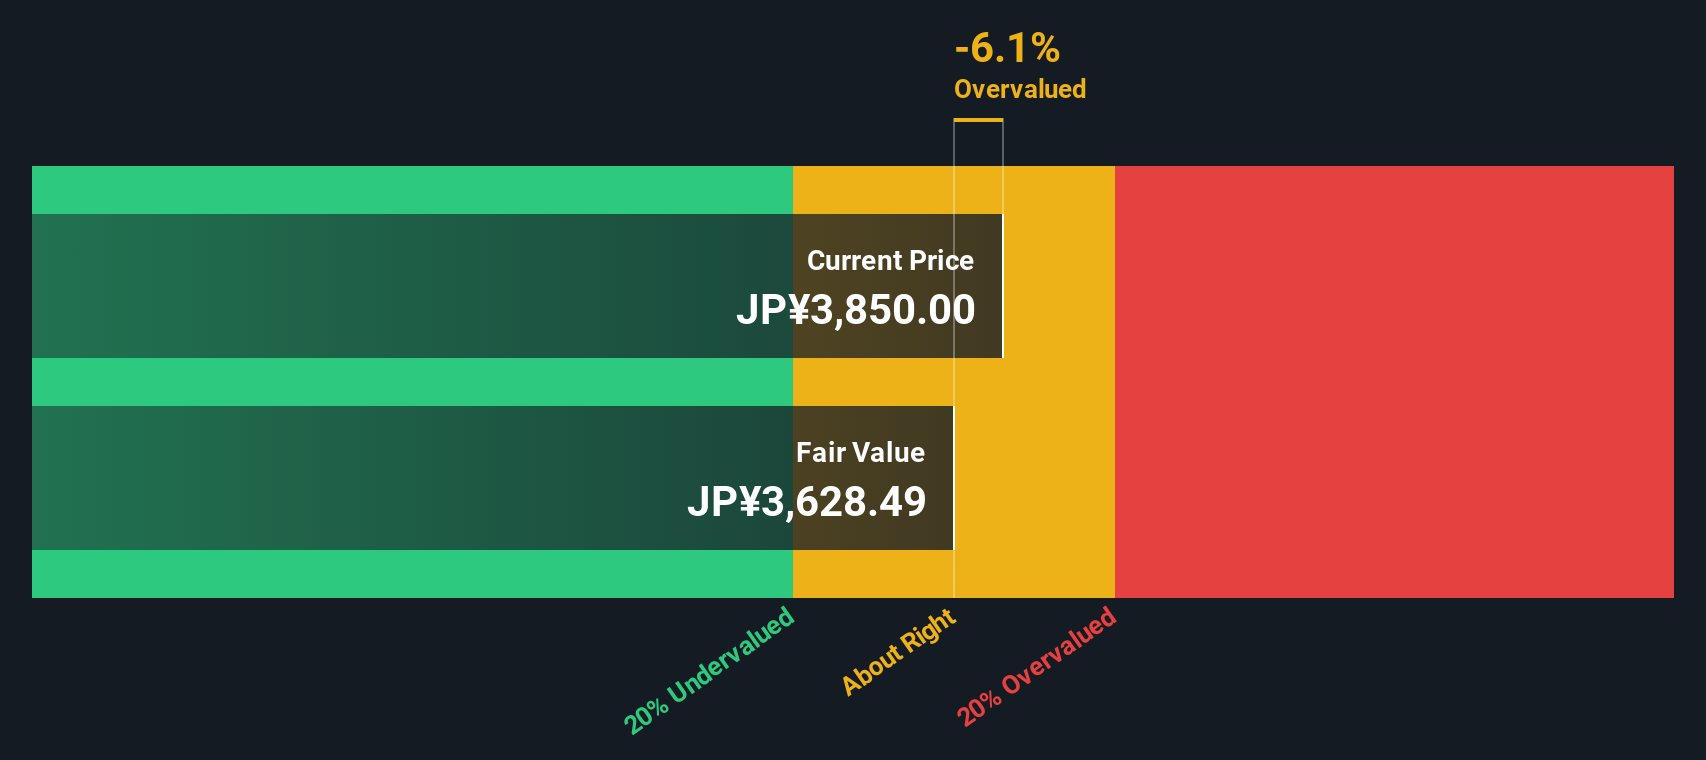
Looking from a different angle, our SWS DCF model estimates a fair value of ¥3,599.11 for YONEX shares. This is below the current price of ¥3,830. This model suggests the stock could be slightly overvalued. Could this hint at limited upside ahead, or is there more to this story?
Look into how the SWS DCF model arrives at its fair value.
Simply Wall St performs a discounted cash flow (DCF) on every stock in the world every day (check out YONEX for example). We show the entire calculation in full. You can track the result in your watchlist or portfolio and be alerted when this changes, or use our stock screener to discover undervalued stocks based on their cash flows. If you save a screener we even alert you when new companies match - so you never miss a potential opportunity.
Build Your Own YONEX Narrative
If you’d rather investigate YONEX’s outlook for yourself or believe a different perspective offers better insights, you can craft your own view in just a few minutes with Do it your way.
A great starting point for your YONEX research is our analysis highlighting 2 key rewards and 1 important warning sign that could impact your investment decision.
Looking for more investment ideas?
Don’t let an opportunity slip by. Make your next smart move by searching for stocks with major upside across the latest market trends and breakthroughs.
- Tap into the potential of these 878 undervalued stocks based on cash flows to find stocks trading at a discount and position yourself ahead of the crowd.
- Uncover market disruptors by checking out these 24 AI penny stocks, packed with companies harnessing artificial intelligence to shape entire industries.
- Secure steady income by browsing these 18 dividend stocks with yields > 3%, which highlights stocks offering attractive yields above 3%.
This article by Simply Wall St is general in nature. We provide commentary based on historical data and analyst forecasts only using an unbiased methodology and our articles are not intended to be financial advice. It does not constitute a recommendation to buy or sell any stock, and does not take account of your objectives, or your financial situation. We aim to bring you long-term focused analysis driven by fundamental data. Note that our analysis may not factor in the latest price-sensitive company announcements or qualitative material. Simply Wall St has no position in any stocks mentioned.
New: Manage All Your Stock Portfolios in One Place
We've created the ultimate portfolio companion for stock investors, and it's free.
• Connect an unlimited number of Portfolios and see your total in one currency
• Be alerted to new Warning Signs or Risks via email or mobile
• Track the Fair Value of your stocks
Have feedback on this article? Concerned about the content? Get in touch with us directly. Alternatively, email editorial-team@simplywallst.com
About TSE:7906
Excellent balance sheet with proven track record.
Similar Companies
Market Insights

Advertisement
Community Narratives
Finding The True Value Of A Logistics Powerhouse
Fair Value US$95.21|8.4% undervalued
NV
Community Contributor
Paradigm Biopharmaceuticals Will Lead Osteoarthritis Treatment with Zilosul's FDA Success
Fair Value AU$5.50|92.1% undervalued
AM
Community Contributor
Barrick Mining (ABX:CA): A Gold Hedge against a U.S. Shutdown
Fair Value CA$60.00|24.2% undervalued
GM
Community Contributor