
Advertisement
Howard Marks put it nicely when he said that, rather than worrying about share price volatility, 'The possibility of permanent loss is the risk I worry about... and every practical investor I know worries about.' It's only natural to consider a company's balance sheet when you examine how risky it is, since debt is often involved when a business collapses. Importantly, Freesia Macross Corporation (TSE:6343) does carry debt. But is this debt a concern to shareholders?
Why Does Debt Bring Risk?
Generally speaking, debt only becomes a real problem when a company can't easily pay it off, either by raising capital or with its own cash flow. If things get really bad, the lenders can take control of the business. However, a more usual (but still expensive) situation is where a company must dilute shareholders at a cheap share price simply to get debt under control. Of course, plenty of companies use debt to fund growth, without any negative consequences. When we examine debt levels, we first consider both cash and debt levels, together.
What Is Freesia Macross's Net Debt?
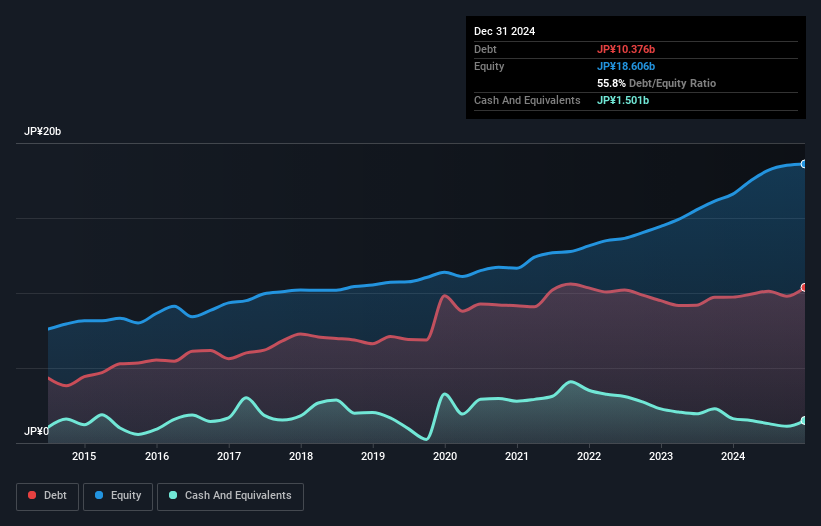
You can click the graphic below for the historical numbers, but it shows that as of December 2024 Freesia Macross had JP¥10.4b of debt, an increase on JP¥9.73b, over one year. However, it does have JP¥1.50b in cash offsetting this, leading to net debt of about JP¥8.88b.
How Strong Is Freesia Macross' Balance Sheet?
The latest balance sheet data shows that Freesia Macross had liabilities of JP¥3.69b due within a year, and liabilities of JP¥9.88b falling due after that. Offsetting these obligations, it had cash of JP¥1.50b as well as receivables valued at JP¥1.15b due within 12 months. So it has liabilities totalling JP¥10.9b more than its cash and near-term receivables, combined.
The deficiency here weighs heavily on the JP¥3.87b company itself, as if a child were struggling under the weight of an enormous back-pack full of books, his sports gear, and a trumpet. So we'd watch its balance sheet closely, without a doubt. After all, Freesia Macross would likely require a major re-capitalisation if it had to pay its creditors today.
View our latest analysis for Freesia Macross
We use two main ratios to inform us about debt levels relative to earnings. The first is net debt divided by earnings before interest, tax, depreciation, and amortization (EBITDA), while the second is how many times its earnings before interest and tax (EBIT) covers its interest expense (or its interest cover, for short). Thus we consider debt relative to earnings both with and without depreciation and amortization expenses.
Strangely Freesia Macross has a sky high EBITDA ratio of 7.0, implying high debt, but a strong interest coverage of 1k. So either it has access to very cheap long term debt or that interest expense is going to grow! We note that Freesia Macross grew its EBIT by 20% in the last year, and that should make it easier to pay down debt, going forward. When analysing debt levels, the balance sheet is the obvious place to start. But it is Freesia Macross's earnings that will influence how the balance sheet holds up in the future. So if you're keen to discover more about its earnings, it might be worth checking out this graph of its long term earnings trend .
Finally, a company can only pay off debt with cold hard cash, not accounting profits. So the logical step is to look at the proportion of that EBIT that is matched by actual free cash flow. During the last three years, Freesia Macross burned a lot of cash. While that may be a result of expenditure for growth, it does make the debt far more risky.
Our View
On the face of it, Freesia Macross's conversion of EBIT to free cash flow left us tentative about the stock, and its level of total liabilities was no more enticing than the one empty restaurant on the busiest night of the year. But at least it's pretty decent at covering its interest expense with its EBIT; that's encouraging. Overall, it seems to us that Freesia Macross's balance sheet is really quite a risk to the business. For this reason we're pretty cautious about the stock, and we think shareholders should keep a close eye on its liquidity. The balance sheet is clearly the area to focus on when you are analysing debt. However, not all investment risk resides within the balance sheet - far from it. For instance, we've identified 2 warning signs for Freesia Macross (1 is concerning) you should be aware of.
When all is said and done, sometimes its easier to focus on companies that don't even need debt. Readers can access a list of growth stocks with zero net debt 100% free, right now.
New: AI Stock Screener & Alerts
Our new AI Stock Screener scans the market every day to uncover opportunities.
• Dividend Powerhouses (3%+ Yield)
• Undervalued Small Caps with Insider Buying
• High growth Tech and AI Companies
Or build your own from over 50 metrics.
Have feedback on this article? Concerned about the content? Get in touch with us directly. Alternatively, email editorial-team (at) simplywallst.com.
This article by Simply Wall St is general in nature. We provide commentary based on historical data and analyst forecasts only using an unbiased methodology and our articles are not intended to be financial advice. It does not constitute a recommendation to buy or sell any stock, and does not take account of your objectives, or your financial situation. We aim to bring you long-term focused analysis driven by fundamental data. Note that our analysis may not factor in the latest price-sensitive company announcements or qualitative material. Simply Wall St has no position in any stocks mentioned.
About TSE:6343
Freesia Macross
Engages in the real estate transaction, lease and rental, and supervision business in Japan.
Proven track record with mediocre balance sheet.
Market Insights

Advertisement
Community Narratives
The "Molecular Pencil": Why Beam's Technology is Built to Win
Fair Value US$65.01|65.4% undervalued
DA
Community Contributor
The silent giant behind virtually every advanced chip powering AI, smartphones, and modern infrastructure.
Fair Value US$310.00|6.1% undervalued
OS
Community Contributor
ADP Stock: Solid Fundamentals, But AI Investments Test Its Margin Resilience
Fair Value US$387.77|34.2% undervalued
YI
Community Contributor
MINISO's fair value is projected at 26.69 with an anticipated PE ratio shift of 20x
Fair Value US$24.03|9.6% undervalued
BE
Community Contributor