
Advertisement
Some say volatility, rather than debt, is the best way to think about risk as an investor, but Warren Buffett famously said that 'Volatility is far from synonymous with risk.' So it seems the smart money knows that debt - which is usually involved in bankruptcies - is a very important factor, when you assess how risky a company is. We can see that Freesia Macross Corporation (TSE:6343) does use debt in its business. But the real question is whether this debt is making the company risky.
When Is Debt Dangerous?
Generally speaking, debt only becomes a real problem when a company can't easily pay it off, either by raising capital or with its own cash flow. If things get really bad, the lenders can take control of the business. While that is not too common, we often do see indebted companies permanently diluting shareholders because lenders force them to raise capital at a distressed price. By replacing dilution, though, debt can be an extremely good tool for businesses that need capital to invest in growth at high rates of return. The first step when considering a company's debt levels is to consider its cash and debt together.
View our latest analysis for Freesia Macross
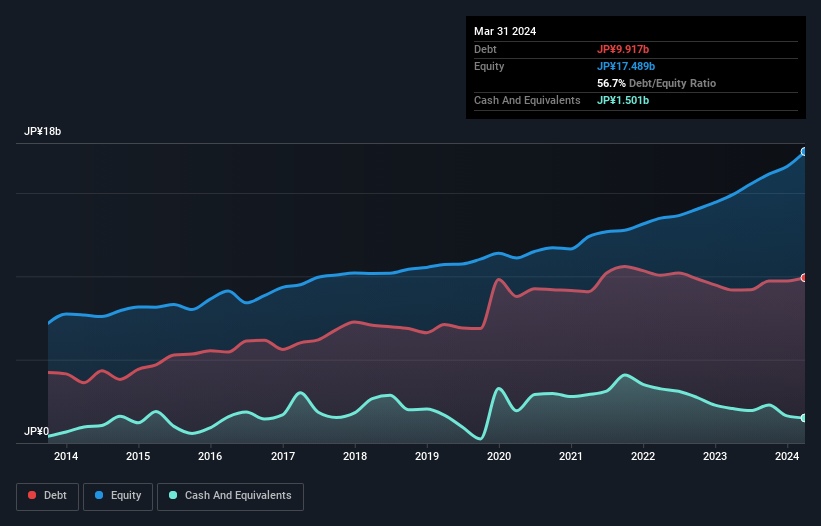
What Is Freesia Macross's Debt?
As you can see below, at the end of March 2024, Freesia Macross had JP¥9.92b of debt, up from JP¥9.18b a year ago. Click the image for more detail. However, because it has a cash reserve of JP¥1.50b, its net debt is less, at about JP¥8.42b.
How Healthy Is Freesia Macross' Balance Sheet?
Zooming in on the latest balance sheet data, we can see that Freesia Macross had liabilities of JP¥3.95b due within 12 months and liabilities of JP¥9.04b due beyond that. Offsetting this, it had JP¥1.50b in cash and JP¥1.16b in receivables that were due within 12 months. So its liabilities outweigh the sum of its cash and (near-term) receivables by JP¥10.3b.
The deficiency here weighs heavily on the JP¥4.14b company itself, as if a child were struggling under the weight of an enormous back-pack full of books, his sports gear, and a trumpet. So we definitely think shareholders need to watch this one closely. At the end of the day, Freesia Macross would probably need a major re-capitalization if its creditors were to demand repayment.
We use two main ratios to inform us about debt levels relative to earnings. The first is net debt divided by earnings before interest, tax, depreciation, and amortization (EBITDA), while the second is how many times its earnings before interest and tax (EBIT) covers its interest expense (or its interest cover, for short). This way, we consider both the absolute quantum of the debt, as well as the interest rates paid on it.
Strangely Freesia Macross has a sky high EBITDA ratio of 7.3, implying high debt, but a strong interest coverage of 34.4. So either it has access to very cheap long term debt or that interest expense is going to grow! We saw Freesia Macross grow its EBIT by 5.7% in the last twelve months. That's far from incredible but it is a good thing, when it comes to paying off debt. The balance sheet is clearly the area to focus on when you are analysing debt. But it is Freesia Macross's earnings that will influence how the balance sheet holds up in the future. So when considering debt, it's definitely worth looking at the earnings trend. Click here for an interactive snapshot.
Finally, while the tax-man may adore accounting profits, lenders only accept cold hard cash. So we always check how much of that EBIT is translated into free cash flow. Over the last three years, Freesia Macross saw substantial negative free cash flow, in total. While investors are no doubt expecting a reversal of that situation in due course, it clearly does mean its use of debt is more risky.
Our View
On the face of it, Freesia Macross's conversion of EBIT to free cash flow left us tentative about the stock, and its level of total liabilities was no more enticing than the one empty restaurant on the busiest night of the year. But at least it's pretty decent at covering its interest expense with its EBIT; that's encouraging. Overall, it seems to us that Freesia Macross's balance sheet is really quite a risk to the business. So we're almost as wary of this stock as a hungry kitten is about falling into its owner's fish pond: once bitten, twice shy, as they say. The balance sheet is clearly the area to focus on when you are analysing debt. However, not all investment risk resides within the balance sheet - far from it. We've identified 2 warning signs with Freesia Macross (at least 1 which makes us a bit uncomfortable) , and understanding them should be part of your investment process.
Of course, if you're the type of investor who prefers buying stocks without the burden of debt, then don't hesitate to discover our exclusive list of net cash growth stocks, today.
New: AI Stock Screener & Alerts
Our new AI Stock Screener scans the market every day to uncover opportunities.
• Dividend Powerhouses (3%+ Yield)
• Undervalued Small Caps with Insider Buying
• High growth Tech and AI Companies
Or build your own from over 50 metrics.
Have feedback on this article? Concerned about the content? Get in touch with us directly. Alternatively, email editorial-team (at) simplywallst.com.
This article by Simply Wall St is general in nature. We provide commentary based on historical data and analyst forecasts only using an unbiased methodology and our articles are not intended to be financial advice. It does not constitute a recommendation to buy or sell any stock, and does not take account of your objectives, or your financial situation. We aim to bring you long-term focused analysis driven by fundamental data. Note that our analysis may not factor in the latest price-sensitive company announcements or qualitative material. Simply Wall St has no position in any stocks mentioned.
Have feedback on this article? Concerned about the content? Get in touch with us directly. Alternatively, email editorial-team@simplywallst.com
About TSE:6343
Freesia Macross
Engages in the real estate transaction, lease and rental, and supervision business in Japan.
Proven track record with mediocre balance sheet.
Market Insights

Advertisement
Community Narratives
MINISO's fair value is projected at 26.69 with an anticipated PE ratio shift of 20x
Fair Value US$24.03|11.4% undervalued
BE
Community Contributor
Procter & Gamble: A Dividend Giant Facing Slowing Growth
Fair Value US$119.81|23.5% overvalued
AN
Community Contributor
Eli Lilly's Future Growth Driven by Tirzepatide and Favorable Market Conditions
Fair Value US$1.19k|14.0% undervalued
EA
Community Contributor