
Advertisement
The external fund manager backed by Berkshire Hathaway's Charlie Munger, Li Lu, makes no bones about it when he says 'The biggest investment risk is not the volatility of prices, but whether you will suffer a permanent loss of capital.' So it seems the smart money knows that debt - which is usually involved in bankruptcies - is a very important factor, when you assess how risky a company is. As with many other companies Crossfor Co.,Ltd. (TYO:7810) makes use of debt. But is this debt a concern to shareholders?
When Is Debt A Problem?
Debt and other liabilities become risky for a business when it cannot easily fulfill those obligations, either with free cash flow or by raising capital at an attractive price. Part and parcel of capitalism is the process of 'creative destruction' where failed businesses are mercilessly liquidated by their bankers. However, a more common (but still painful) scenario is that it has to raise new equity capital at a low price, thus permanently diluting shareholders. Of course, plenty of companies use debt to fund growth, without any negative consequences. The first thing to do when considering how much debt a business uses is to look at its cash and debt together.
View our latest analysis for CrossforLtd
What Is CrossforLtd's Debt?
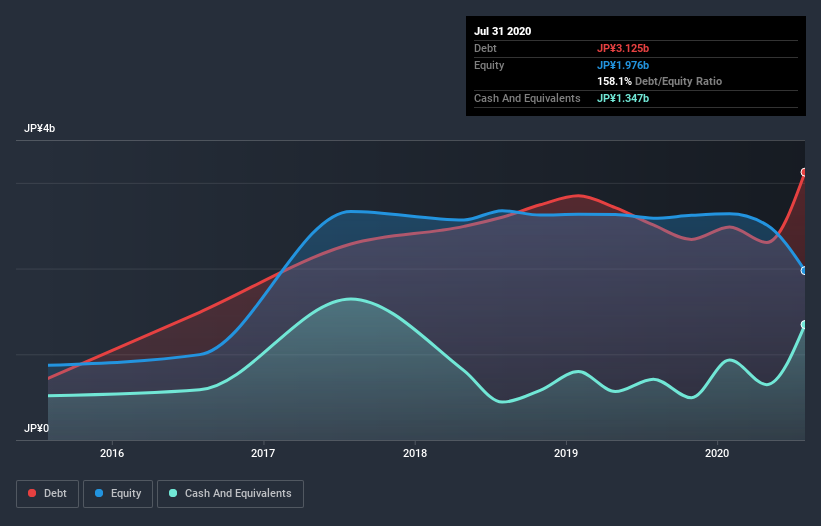
You can click the graphic below for the historical numbers, but it shows that as of July 2020 CrossforLtd had JP¥3.13b of debt, an increase on JP¥2.51b, over one year. However, because it has a cash reserve of JP¥1.35b, its net debt is less, at about JP¥1.78b.
How Healthy Is CrossforLtd's Balance Sheet?
We can see from the most recent balance sheet that CrossforLtd had liabilities of JP¥1.58b falling due within a year, and liabilities of JP¥1.65b due beyond that. On the other hand, it had cash of JP¥1.35b and JP¥208.0m worth of receivables due within a year. So its liabilities outweigh the sum of its cash and (near-term) receivables by JP¥1.67b.
While this might seem like a lot, it is not so bad since CrossforLtd has a market capitalization of JP¥4.74b, and so it could probably strengthen its balance sheet by raising capital if it needed to. But it's clear that we should definitely closely examine whether it can manage its debt without dilution. When analysing debt levels, the balance sheet is the obvious place to start. But you can't view debt in total isolation; since CrossforLtd will need earnings to service that debt. So if you're keen to discover more about its earnings, it might be worth checking out this graph of its long term earnings trend.
In the last year CrossforLtd had a loss before interest and tax, and actually shrunk its revenue by 33%, to JP¥2.3b. To be frank that doesn't bode well.
Caveat Emptor
While CrossforLtd's falling revenue is about as heartwarming as a wet blanket, arguably its earnings before interest and tax (EBIT) loss is even less appealing. Indeed, it lost JP¥414m at the EBIT level. When we look at that and recall the liabilities on its balance sheet, relative to cash, it seems unwise to us for the company to have any debt. Quite frankly we think the balance sheet is far from match-fit, although it could be improved with time. For example, we would not want to see a repeat of last year's loss of JP¥611m. So we do think this stock is quite risky. The balance sheet is clearly the area to focus on when you are analysing debt. But ultimately, every company can contain risks that exist outside of the balance sheet. Like risks, for instance. Every company has them, and we've spotted 3 warning signs for CrossforLtd (of which 2 don't sit too well with us!) you should know about.
If you're interested in investing in businesses that can grow profits without the burden of debt, then check out this free list of growing businesses that have net cash on the balance sheet.
If you decide to trade CrossforLtd, use the lowest-cost* platform that is rated #1 Overall by Barron’s, Interactive Brokers. Trade stocks, options, futures, forex, bonds and funds on 135 markets, all from a single integrated account. Promoted
New: AI Stock Screener & Alerts
Our new AI Stock Screener scans the market every day to uncover opportunities.
• Dividend Powerhouses (3%+ Yield)
• Undervalued Small Caps with Insider Buying
• High growth Tech and AI Companies
Or build your own from over 50 metrics.
This article by Simply Wall St is general in nature. It does not constitute a recommendation to buy or sell any stock, and does not take account of your objectives, or your financial situation. We aim to bring you long-term focused analysis driven by fundamental data. Note that our analysis may not factor in the latest price-sensitive company announcements or qualitative material. Simply Wall St has no position in any stocks mentioned.
*Interactive Brokers Rated Lowest Cost Broker by StockBrokers.com Annual Online Review 2020
Have feedback on this article? Concerned about the content? Get in touch with us directly. Alternatively, email editorial-team@simplywallst.com.
About TSE:7810
CrossforLtd
Engages in the design, manufacture, import, and sale of jewelry and diamonds, and accessories in Japan and internationally.
Questionable track record with imperfect balance sheet.
Market Insights

Advertisement
Community Narratives
MicroVision will explode future revenue by 380.37% with a vision towards success
Fair Value US$60.00|98.4% undervalued
TH
Community Contributor
The Indispensable Artery for a New North American Economy
Fair Value CA$132.87|1.3% undervalued
TI
Community Contributor