
Advertisement
- Japan
- /
- Commercial Services
- /
- TSE:7984
These 4 Measures Indicate That Kokuyo (TSE:7984) Is Using Debt Safely
The external fund manager backed by Berkshire Hathaway's Charlie Munger, Li Lu, makes no bones about it when he says 'The biggest investment risk is not the volatility of prices, but whether you will suffer a permanent loss of capital.' So it might be obvious that you need to consider debt, when you think about how risky any given stock is, because too much debt can sink a company. We note that Kokuyo Co., Ltd. (TSE:7984) does have debt on its balance sheet. But should shareholders be worried about its use of debt?
What Risk Does Debt Bring?
Debt is a tool to help businesses grow, but if a business is incapable of paying off its lenders, then it exists at their mercy. If things get really bad, the lenders can take control of the business. While that is not too common, we often do see indebted companies permanently diluting shareholders because lenders force them to raise capital at a distressed price. Of course, the upside of debt is that it often represents cheap capital, especially when it replaces dilution in a company with the ability to reinvest at high rates of return. When we think about a company's use of debt, we first look at cash and debt together.
What Is Kokuyo's Net Debt?
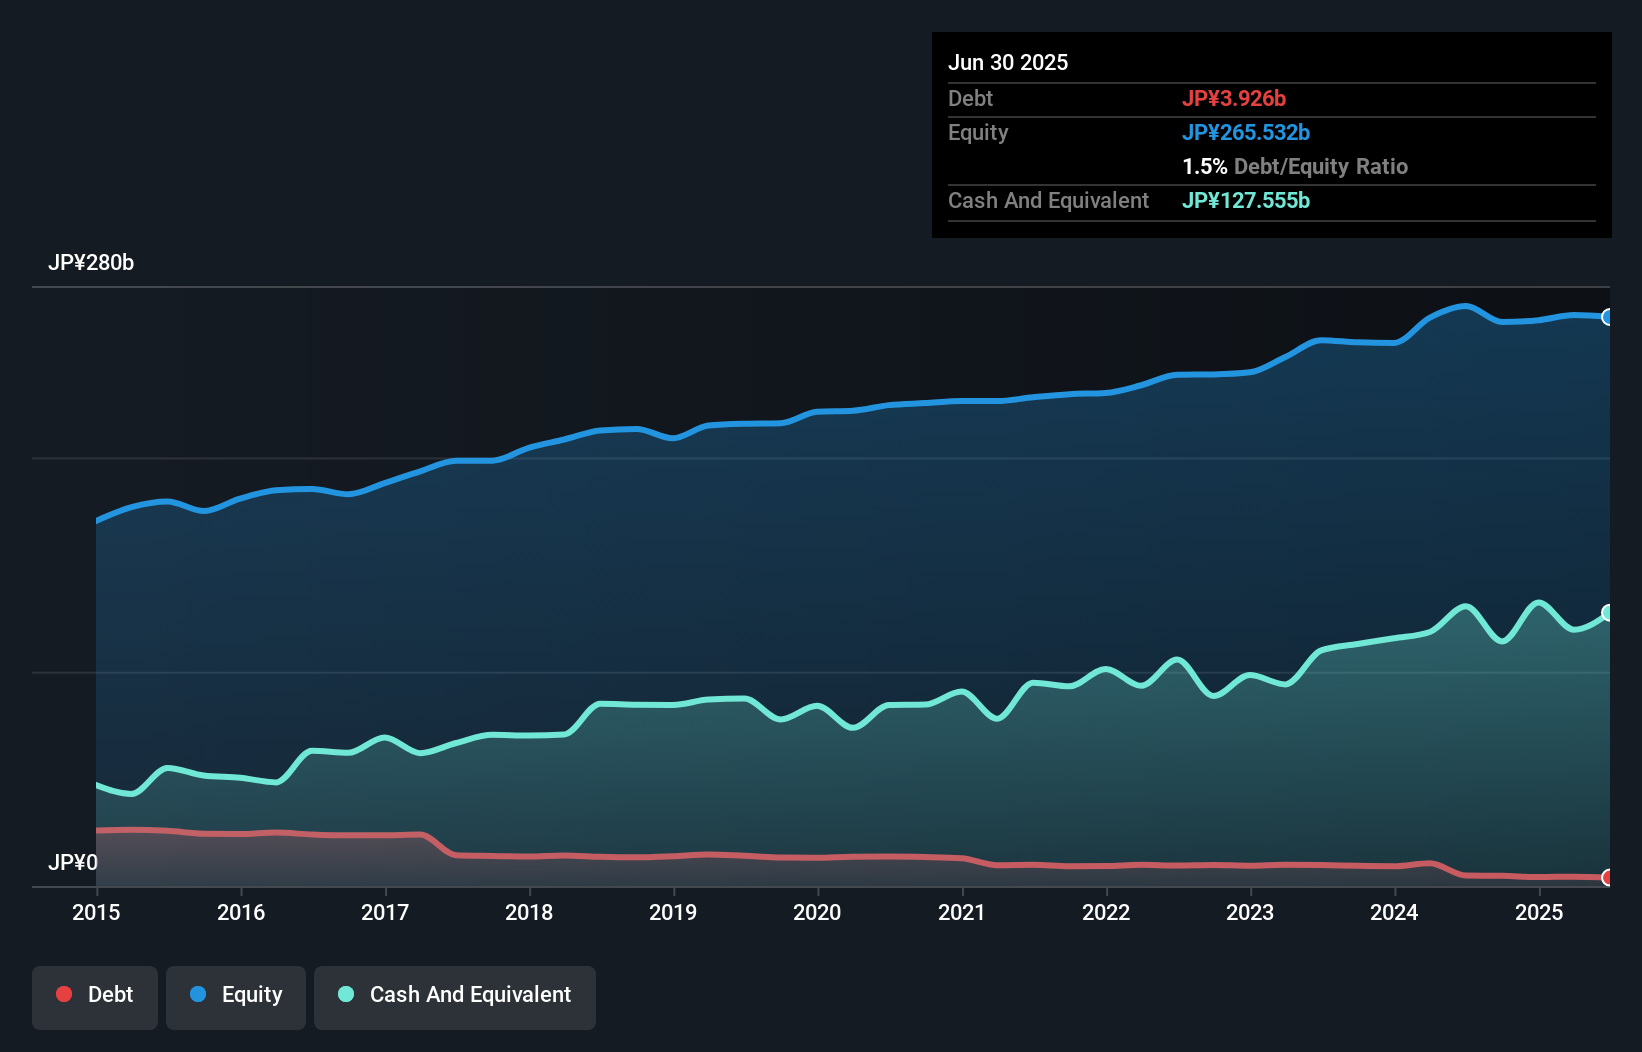
The image below, which you can click on for greater detail, shows that Kokuyo had debt of JP¥3.93b at the end of June 2025, a reduction from JP¥4.90b over a year. But on the other hand it also has JP¥127.6b in cash, leading to a JP¥123.6b net cash position.
How Strong Is Kokuyo's Balance Sheet?
The latest balance sheet data shows that Kokuyo had liabilities of JP¥75.6b due within a year, and liabilities of JP¥9.93b falling due after that. On the other hand, it had cash of JP¥127.6b and JP¥70.7b worth of receivables due within a year. So it actually has JP¥112.7b more liquid assets than total liabilities.
This surplus liquidity suggests that Kokuyo's balance sheet could take a hit just as well as Homer Simpson's head can take a punch. With this in mind one could posit that its balance sheet means the company is able to handle some adversity. Succinctly put, Kokuyo boasts net cash, so it's fair to say it does not have a heavy debt load!
See our latest analysis for Kokuyo
While Kokuyo doesn't seem to have gained much on the EBIT line, at least earnings remain stable for now. There's no doubt that we learn most about debt from the balance sheet. But it is future earnings, more than anything, that will determine Kokuyo's ability to maintain a healthy balance sheet going forward. So if you're focused on the future you can check out this free report showing analyst profit forecasts.
Finally, a business needs free cash flow to pay off debt; accounting profits just don't cut it. Kokuyo may have net cash on the balance sheet, but it is still interesting to look at how well the business converts its earnings before interest and tax (EBIT) to free cash flow, because that will influence both its need for, and its capacity to manage debt. During the last three years, Kokuyo produced sturdy free cash flow equating to 55% of its EBIT, about what we'd expect. This cold hard cash means it can reduce its debt when it wants to.
Summing Up
While we empathize with investors who find debt concerning, you should keep in mind that Kokuyo has net cash of JP¥123.6b, as well as more liquid assets than liabilities. So we don't think Kokuyo's use of debt is risky. When analysing debt levels, the balance sheet is the obvious place to start. But ultimately, every company can contain risks that exist outside of the balance sheet. For example - Kokuyo has 2 warning signs we think you should be aware of.
If you're interested in investing in businesses that can grow profits without the burden of debt, then check out this free list of growing businesses that have net cash on the balance sheet.
Valuation is complex, but we're here to simplify it.
Discover if Kokuyo might be undervalued or overvalued with our detailed analysis, featuring fair value estimates, potential risks, dividends, insider trades, and its financial condition.
Access Free AnalysisHave feedback on this article? Concerned about the content? Get in touch with us directly. Alternatively, email editorial-team (at) simplywallst.com.
This article by Simply Wall St is general in nature. We provide commentary based on historical data and analyst forecasts only using an unbiased methodology and our articles are not intended to be financial advice. It does not constitute a recommendation to buy or sell any stock, and does not take account of your objectives, or your financial situation. We aim to bring you long-term focused analysis driven by fundamental data. Note that our analysis may not factor in the latest price-sensitive company announcements or qualitative material. Simply Wall St has no position in any stocks mentioned.
About TSE:7984
Kokuyo
Manufactures, purchases, and sells office furniture products in Japan and internationally.
Flawless balance sheet and fair value.
Similar Companies
Market Insights


Advertisement
Community Narratives
The Next Phase of Energy Storage: How NeoVolta Is Tackling America’s Power Crunch
Fair Value US$7.50|35.2% undervalued
MA
Community Contributor
Why EnSilica is Worth Possibly 13x its Current Price
Fair Value UK£5.00|90.0% undervalued
DO
Community Contributor
M&A Activity, Industry Diversification & A Defense Contract Monopoly Will Push BWXT For Healthy Long-Term Growth
Fair Value US$220.00|15.6% undervalued
CL
Community Contributor
A case for Cassiar Gold Corp (TSXV: GLDC) to reach CAD$8-10 before 2030 (X30-37)
Fair Value CA$10.00|97.1% undervalued
AG
Community Contributor