
Advertisement
- Japan
- /
- Professional Services
- /
- TSE:6028
TechnoPro Holdings, Inc. Beat Analyst Estimates: See What The Consensus Is Forecasting For Next Year
The quarterly results for TechnoPro Holdings, Inc. (TSE:6028) were released last week, making it a good time to revisit its performance. The result was positive overall - although revenues of JP¥59b were in line with what the analysts predicted, TechnoPro Holdings surprised by delivering a statutory profit of JP¥47.70 per share, modestly greater than expected. This is an important time for investors, as they can track a company's performance in its report, look at what experts are forecasting for next year, and see if there has been any change to expectations for the business. So we gathered the latest post-earnings forecasts to see what estimates suggest is in store for next year.
We've discovered 1 warning sign about TechnoPro Holdings. View them for free.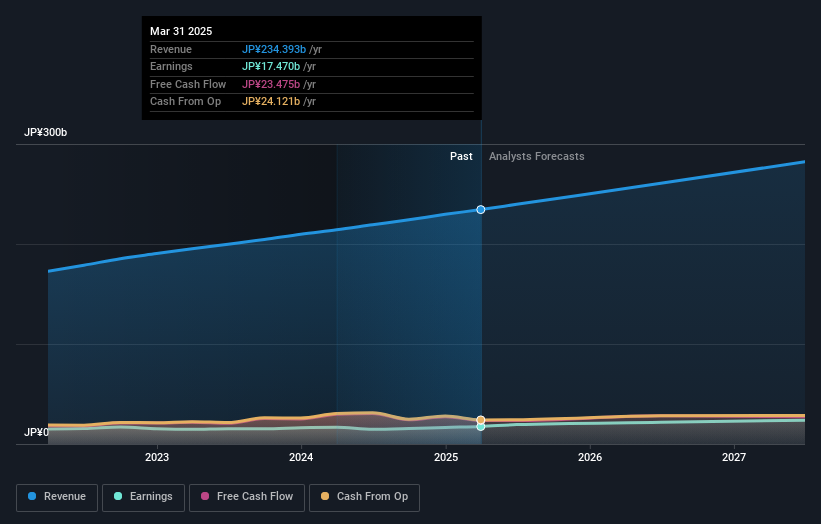
Taking into account the latest results, the consensus forecast from TechnoPro Holdings' nine analysts is for revenues of JP¥260.7b in 2026. This reflects a notable 11% improvement in revenue compared to the last 12 months. Statutory earnings per share are predicted to soar 23% to JP¥206. Yet prior to the latest earnings, the analysts had been anticipated revenues of JP¥260.2b and earnings per share (EPS) of JP¥205 in 2026. The consensus analysts don't seem to have seen anything in these results that would have changed their view on the business, given there's been no major change to their estimates.
See our latest analysis for TechnoPro Holdings
It will come as no surprise then, to learn that the consensus price target is largely unchanged at JP¥3,363. Fixating on a single price target can be unwise though, since the consensus target is effectively the average of analyst price targets. As a result, some investors like to look at the range of estimates to see if there are any diverging opinions on the company's valuation. Currently, the most bullish analyst values TechnoPro Holdings at JP¥3,800 per share, while the most bearish prices it at JP¥2,900. Still, with such a tight range of estimates, it suggeststhe analysts have a pretty good idea of what they think the company is worth.
Taking a look at the bigger picture now, one of the ways we can understand these forecasts is to see how they compare to both past performance and industry growth estimates. We can infer from the latest estimates that forecasts expect a continuation of TechnoPro Holdings'historical trends, as the 8.9% annualised revenue growth to the end of 2026 is roughly in line with the 9.0% annual growth over the past five years. Compare this with the broader industry, which analyst estimates (in aggregate) suggest will see revenues grow 7.0% annually. So it's pretty clear that TechnoPro Holdings is forecast to grow substantially faster than its industry.
The Bottom Line
The most important thing to take away is that there's been no major change in sentiment, with the analysts reconfirming that the business is performing in line with their previous earnings per share estimates. Fortunately, they also reconfirmed their revenue numbers, suggesting that it's tracking in line with expectations. Additionally, our data suggests that revenue is expected to grow faster than the wider industry. There was no real change to the consensus price target, suggesting that the intrinsic value of the business has not undergone any major changes with the latest estimates.
Keeping that in mind, we still think that the longer term trajectory of the business is much more important for investors to consider. At Simply Wall St, we have a full range of analyst estimates for TechnoPro Holdings going out to 2027, and you can see them free on our platform here..
You still need to take note of risks, for example - TechnoPro Holdings has 1 warning sign we think you should be aware of.
Valuation is complex, but we're here to simplify it.
Discover if TechnoPro Holdings might be undervalued or overvalued with our detailed analysis, featuring fair value estimates, potential risks, dividends, insider trades, and its financial condition.
Access Free AnalysisHave feedback on this article? Concerned about the content? Get in touch with us directly. Alternatively, email editorial-team (at) simplywallst.com.
This article by Simply Wall St is general in nature. We provide commentary based on historical data and analyst forecasts only using an unbiased methodology and our articles are not intended to be financial advice. It does not constitute a recommendation to buy or sell any stock, and does not take account of your objectives, or your financial situation. We aim to bring you long-term focused analysis driven by fundamental data. Note that our analysis may not factor in the latest price-sensitive company announcements or qualitative material. Simply Wall St has no position in any stocks mentioned.
About TSE:6028
TechnoPro Holdings
Through its subsidiaries, operates as a temporary staffing and contract work company in Japan and internationally.
Flawless balance sheet with solid track record.
Similar Companies
Market Insights

Advertisement
Community Narratives
Finding The True Value Of A Logistics Powerhouse
Fair Value US$95.21|8.6% undervalued
NV
Community Contributor
Paradigm Biopharmaceuticals Will Lead Osteoarthritis Treatment with Zilosul's FDA Success
Fair Value AU$5.50|92.1% undervalued
AM
Community Contributor
Barrick Mining (ABX:CA): A Gold Hedge against a U.S. Shutdown
Fair Value CA$60.00|25.6% undervalued
GM
Community Contributor