
Advertisement
- Japan
- /
- Professional Services
- /
- TSE:4792
YAMADA Consulting GroupLtd's (TSE:4792) Earnings Seem To Be Promising
Investors signalled that they were pleased with YAMADA Consulting Group Co.,Ltd.'s (TSE:4792) most recent earnings report. According to our analysis of the report, the strong headline profit numbers are supported by strong earnings fundamentals.
Check out our latest analysis for YAMADA Consulting GroupLtd
Examining Cashflow Against YAMADA Consulting GroupLtd's Earnings
One key financial ratio used to measure how well a company converts its profit to free cash flow (FCF) is the accrual ratio. The accrual ratio subtracts the FCF from the profit for a given period, and divides the result by the average operating assets of the company over that time. This ratio tells us how much of a company's profit is not backed by free cashflow.
That means a negative accrual ratio is a good thing, because it shows that the company is bringing in more free cash flow than its profit would suggest. That is not intended to imply we should worry about a positive accrual ratio, but it's worth noting where the accrual ratio is rather high. To quote a 2014 paper by Lewellen and Resutek, "firms with higher accruals tend to be less profitable in the future".
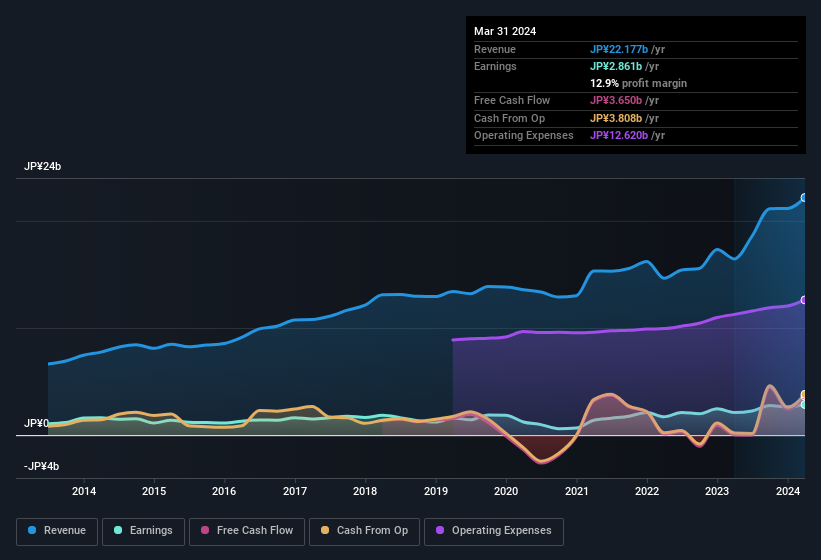
Over the twelve months to March 2024, YAMADA Consulting GroupLtd recorded an accrual ratio of -0.11. That indicates that its free cash flow was a fair bit more than its statutory profit. In fact, it had free cash flow of JP¥3.7b in the last year, which was a lot more than its statutory profit of JP¥2.86b. YAMADA Consulting GroupLtd's free cash flow improved over the last year, which is generally good to see.
Note: we always recommend investors check balance sheet strength. Click here to be taken to our balance sheet analysis of YAMADA Consulting GroupLtd.
Our Take On YAMADA Consulting GroupLtd's Profit Performance
YAMADA Consulting GroupLtd's accrual ratio is solid, and indicates strong free cash flow, as we discussed, above. Because of this, we think YAMADA Consulting GroupLtd's earnings potential is at least as good as it seems, and maybe even better! Better yet, its EPS are growing strongly, which is nice to see. The goal of this article has been to assess how well we can rely on the statutory earnings to reflect the company's potential, but there is plenty more to consider. With this in mind, we wouldn't consider investing in a stock unless we had a thorough understanding of the risks. While conducting our analysis, we found that YAMADA Consulting GroupLtd has 1 warning sign and it would be unwise to ignore it.
Today we've zoomed in on a single data point to better understand the nature of YAMADA Consulting GroupLtd's profit. But there is always more to discover if you are capable of focussing your mind on minutiae. Some people consider a high return on equity to be a good sign of a quality business. While it might take a little research on your behalf, you may find this free collection of companies boasting high return on equity, or this list of stocks with significant insider holdings to be useful.
New: Manage All Your Stock Portfolios in One Place
We've created the ultimate portfolio companion for stock investors, and it's free.
• Connect an unlimited number of Portfolios and see your total in one currency
• Be alerted to new Warning Signs or Risks via email or mobile
• Track the Fair Value of your stocks
Have feedback on this article? Concerned about the content? Get in touch with us directly. Alternatively, email editorial-team (at) simplywallst.com.
This article by Simply Wall St is general in nature. We provide commentary based on historical data and analyst forecasts only using an unbiased methodology and our articles are not intended to be financial advice. It does not constitute a recommendation to buy or sell any stock, and does not take account of your objectives, or your financial situation. We aim to bring you long-term focused analysis driven by fundamental data. Note that our analysis may not factor in the latest price-sensitive company announcements or qualitative material. Simply Wall St has no position in any stocks mentioned.
About TSE:4792
YAMADA Consulting GroupLtd
Provides various consulting services in Japan, Asia, the United States, and internationally.
Adequate balance sheet average dividend payer.
Market Insights

Advertisement
Community Narratives
MINISO's fair value is projected at 26.69 with an anticipated PE ratio shift of 20x
Fair Value US$24.03|11.0% undervalued
BE
Community Contributor
Procter & Gamble: A Dividend Giant Facing Slowing Growth
Fair Value US$119.81|23.3% overvalued
AN
Community Contributor
Eli Lilly's Future Growth Driven by Tirzepatide and Favorable Market Conditions
Fair Value US$1.19k|13.8% undervalued
EA
Community Contributor