
Advertisement
- Japan
- /
- Professional Services
- /
- TSE:4792
We Think You Should Be Aware Of Some Concerning Factors In YAMADA Consulting GroupLtd's (TSE:4792) Earnings
YAMADA Consulting Group Co.,Ltd.'s (TSE:4792 ) stock didn't jump after it announced some healthy earnings. Our analysis showed that there are some concerning factors in the earnings that investors may be cautious of.
A Closer Look At YAMADA Consulting GroupLtd's Earnings
One key financial ratio used to measure how well a company converts its profit to free cash flow (FCF) is the accrual ratio. To get the accrual ratio we first subtract FCF from profit for a period, and then divide that number by the average operating assets for the period. You could think of the accrual ratio from cashflow as the 'non-FCF profit ratio'.
Therefore, it's actually considered a good thing when a company has a negative accrual ratio, but a bad thing if its accrual ratio is positive. While it's not a problem to have a positive accrual ratio, indicating a certain level of non-cash profits, a high accrual ratio is arguably a bad thing, because it indicates paper profits are not matched by cash flow. Notably, there is some academic evidence that suggests that a high accrual ratio is a bad sign for near-term profits, generally speaking.
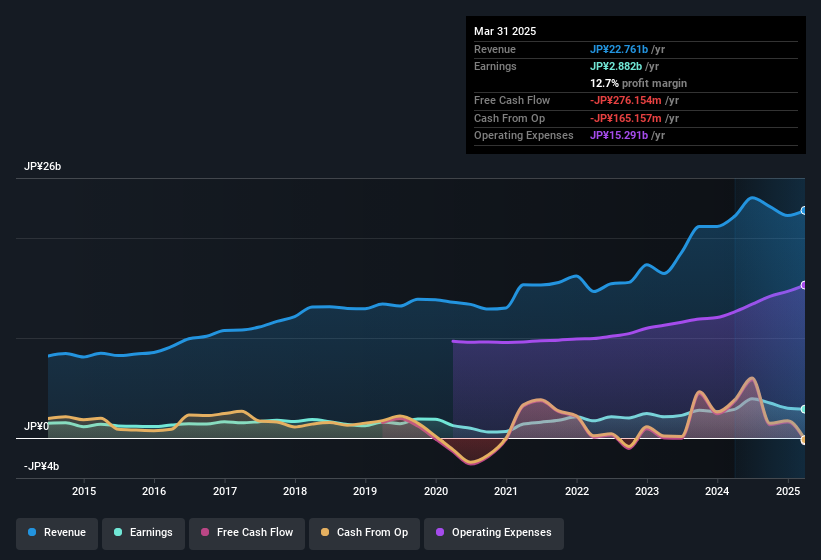
YAMADA Consulting GroupLtd has an accrual ratio of 0.64 for the year to March 2025. As a general rule, that bodes poorly for future profitability. To wit, the company did not generate one whit of free cashflow in that time. Even though it reported a profit of JP¥2.88b, a look at free cash flow indicates it actually burnt through JP¥276m in the last year. It's worth noting that YAMADA Consulting GroupLtd generated positive FCF of JP¥3.7b a year ago, so at least they've done it in the past. One positive for YAMADA Consulting GroupLtd shareholders is that it's accrual ratio was significantly better last year, providing reason to believe that it may return to stronger cash conversion in the future. Shareholders should look for improved cashflow relative to profit in the current year, if that is indeed the case.
Note: we always recommend investors check balance sheet strength. Click here to be taken to our balance sheet analysis of YAMADA Consulting GroupLtd.
Our Take On YAMADA Consulting GroupLtd's Profit Performance
As we discussed above, we think YAMADA Consulting GroupLtd's earnings were not supported by free cash flow, which might concern some investors. As a result, we think it may well be the case that YAMADA Consulting GroupLtd's underlying earnings power is lower than its statutory profit. But at least holders can take some solace from the 67% per annum growth in EPS for the last three. Of course, we've only just scratched the surface when it comes to analysing its earnings; one could also consider margins, forecast growth, and return on investment, among other factors. So while earnings quality is important, it's equally important to consider the risks facing YAMADA Consulting GroupLtd at this point in time. Be aware that YAMADA Consulting GroupLtd is showing 2 warning signs in our investment analysis and 1 of those is a bit unpleasant...
This note has only looked at a single factor that sheds light on the nature of YAMADA Consulting GroupLtd's profit. But there are plenty of other ways to inform your opinion of a company. Some people consider a high return on equity to be a good sign of a quality business. While it might take a little research on your behalf, you may find this free collection of companies boasting high return on equity, or this list of stocks with significant insider holdings to be useful.
New: Manage All Your Stock Portfolios in One Place
We've created the ultimate portfolio companion for stock investors, and it's free.
• Connect an unlimited number of Portfolios and see your total in one currency
• Be alerted to new Warning Signs or Risks via email or mobile
• Track the Fair Value of your stocks
Have feedback on this article? Concerned about the content? Get in touch with us directly. Alternatively, email editorial-team (at) simplywallst.com.
This article by Simply Wall St is general in nature. We provide commentary based on historical data and analyst forecasts only using an unbiased methodology and our articles are not intended to be financial advice. It does not constitute a recommendation to buy or sell any stock, and does not take account of your objectives, or your financial situation. We aim to bring you long-term focused analysis driven by fundamental data. Note that our analysis may not factor in the latest price-sensitive company announcements or qualitative material. Simply Wall St has no position in any stocks mentioned.
About TSE:4792
YAMADA Consulting GroupLtd
Provides various consulting services in Japan, Asia, the United States, and internationally.
Adequate balance sheet average dividend payer.
Market Insights

Advertisement
Community Narratives
MINISO's fair value is projected at 26.69 with an anticipated PE ratio shift of 20x
Fair Value US$24.03|11.0% undervalued
BE
Community Contributor
Procter & Gamble: A Dividend Giant Facing Slowing Growth
Fair Value US$119.81|23.3% overvalued
AN
Community Contributor
Eli Lilly's Future Growth Driven by Tirzepatide and Favorable Market Conditions
Fair Value US$1.19k|13.8% undervalued
EA
Community Contributor