
Advertisement
The external fund manager backed by Berkshire Hathaway's Charlie Munger, Li Lu, makes no bones about it when he says 'The biggest investment risk is not the volatility of prices, but whether you will suffer a permanent loss of capital.' When we think about how risky a company is, we always like to look at its use of debt, since debt overload can lead to ruin. We note that UT Group Co.,Ltd. (TSE:2146) does have debt on its balance sheet. But should shareholders be worried about its use of debt?
When Is Debt Dangerous?
Debt assists a business until the business has trouble paying it off, either with new capital or with free cash flow. In the worst case scenario, a company can go bankrupt if it cannot pay its creditors. However, a more common (but still painful) scenario is that it has to raise new equity capital at a low price, thus permanently diluting shareholders. Of course, the upside of debt is that it often represents cheap capital, especially when it replaces dilution in a company with the ability to reinvest at high rates of return. The first step when considering a company's debt levels is to consider its cash and debt together.
How Much Debt Does UT GroupLtd Carry?
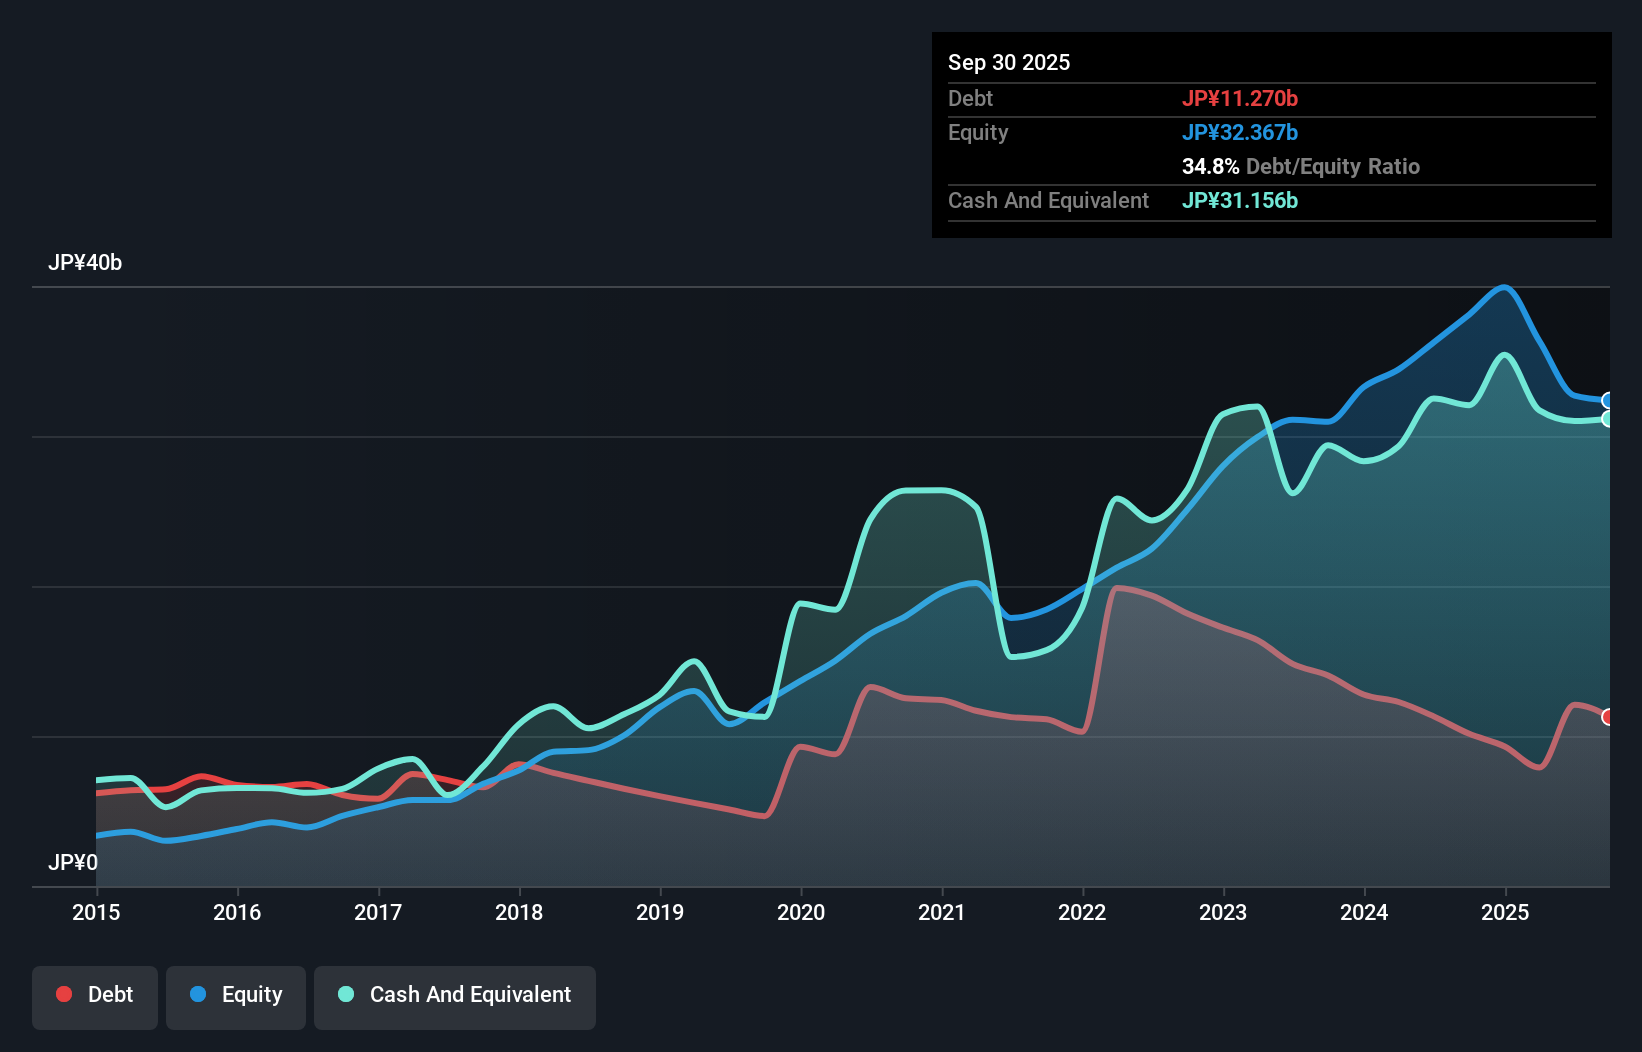
You can click the graphic below for the historical numbers, but it shows that as of September 2025 UT GroupLtd had JP¥11.3b of debt, an increase on JP¥10.1b, over one year. But it also has JP¥31.2b in cash to offset that, meaning it has JP¥19.9b net cash.
How Healthy Is UT GroupLtd's Balance Sheet?
Zooming in on the latest balance sheet data, we can see that UT GroupLtd had liabilities of JP¥21.9b due within 12 months and liabilities of JP¥9.72b due beyond that. Offsetting this, it had JP¥31.2b in cash and JP¥19.3b in receivables that were due within 12 months. So it can boast JP¥18.9b more liquid assets than total liabilities.
This excess liquidity suggests that UT GroupLtd is taking a careful approach to debt. Because it has plenty of assets, it is unlikely to have trouble with its lenders. Succinctly put, UT GroupLtd boasts net cash, so it's fair to say it does not have a heavy debt load!
See our latest analysis for UT GroupLtd
Also positive, UT GroupLtd grew its EBIT by 22% in the last year, and that should make it easier to pay down debt, going forward. There's no doubt that we learn most about debt from the balance sheet. But it is future earnings, more than anything, that will determine UT GroupLtd's ability to maintain a healthy balance sheet going forward. So if you're focused on the future you can check out this free report showing analyst profit forecasts.
Finally, while the tax-man may adore accounting profits, lenders only accept cold hard cash. While UT GroupLtd has net cash on its balance sheet, it's still worth taking a look at its ability to convert earnings before interest and tax (EBIT) to free cash flow, to help us understand how quickly it is building (or eroding) that cash balance. Over the most recent three years, UT GroupLtd recorded free cash flow worth 75% of its EBIT, which is around normal, given free cash flow excludes interest and tax. This free cash flow puts the company in a good position to pay down debt, when appropriate.
Summing Up
While we empathize with investors who find debt concerning, you should keep in mind that UT GroupLtd has net cash of JP¥19.9b, as well as more liquid assets than liabilities. And it impressed us with free cash flow of JP¥5.5b, being 75% of its EBIT. So we don't think UT GroupLtd's use of debt is risky. There's no doubt that we learn most about debt from the balance sheet. However, not all investment risk resides within the balance sheet - far from it. These risks can be hard to spot. Every company has them, and we've spotted 2 warning signs for UT GroupLtd (of which 1 is significant!) you should know about.
Of course, if you're the type of investor who prefers buying stocks without the burden of debt, then don't hesitate to discover our exclusive list of net cash growth stocks, today.
New: AI Stock Screener & Alerts
Our new AI Stock Screener scans the market every day to uncover opportunities.
• Dividend Powerhouses (3%+ Yield)
• Undervalued Small Caps with Insider Buying
• High growth Tech and AI Companies
Or build your own from over 50 metrics.
Have feedback on this article? Concerned about the content? Get in touch with us directly. Alternatively, email editorial-team (at) simplywallst.com.
This article by Simply Wall St is general in nature. We provide commentary based on historical data and analyst forecasts only using an unbiased methodology and our articles are not intended to be financial advice. It does not constitute a recommendation to buy or sell any stock, and does not take account of your objectives, or your financial situation. We aim to bring you long-term focused analysis driven by fundamental data. Note that our analysis may not factor in the latest price-sensitive company announcements or qualitative material. Simply Wall St has no position in any stocks mentioned.
About TSE:2146
UT GroupLtd
Engages in the dispatch and outsourcing of permanent employees in the manufacturing, design and development, construction, and other sectors in Japan.
Flawless balance sheet with moderate growth potential.
Market Insights

Advertisement
Community Narratives
MicroVision will explode future revenue by 380.37% with a vision towards success
Fair Value US$60.00|98.5% undervalued
TH
Community Contributor
The Indispensable Artery for a New North American Economy
Fair Value CA$132.87|2.3% undervalued
TI
Community Contributor