Stock Analysis
- Japan
- /
- Trade Distributors
- /
- TSE:8002
Marubeni Full Year 2024 Earnings: EPS Beats Expectations, Revenues Lag


Marubeni (TSE:8002) Full Year 2024 Results
Key Financial Results
- Revenue: JP¥7.25t (down 21% from FY 2023).
- Net income: JP¥470.5b (down 13% from FY 2023).
- Profit margin: 6.5% (up from 5.9% in FY 2023). The increase in margin was driven by lower expenses.
- EPS: JP¥280 (down from JP¥316 in FY 2023).
All figures shown in the chart above are for the trailing 12 month (TTM) period
Marubeni EPS Beats Expectations, Revenues Fall Short
Revenue missed analyst estimates by 9.3%. Earnings per share (EPS) exceeded analyst estimates by 1.5%.
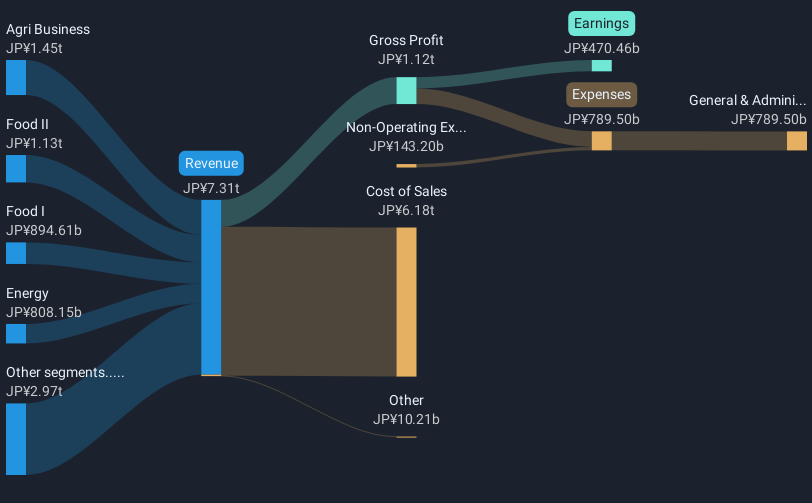
The primary driver behind last 12 months revenue was the Agri Business segment contributing a total revenue of JP¥1.45t (20% of total revenue). Notably, cost of sales worth JP¥6.18t amounted to 85% of total revenue thereby underscoring the impact on earnings. The largest operating expense was General & Administrative costs, amounting to JP¥789.5b (100% of total expenses). Over the last 12 months, the company's earnings were enhanced by non-operating gains of JP¥143.2b. Explore how 8002's revenue and expenses shape its earnings.
Looking ahead, revenue is forecast to grow 3.4% p.a. on average during the next 3 years, while revenues in the Trade Distributors industry in Japan are expected to remain flat.
Performance of the Japanese Trade Distributors industry.
The company's share price is broadly unchanged from a week ago.
Risk Analysis
Be aware that Marubeni is showing 2 warning signs in our investment analysis and 1 of those is a bit unpleasant...
Valuation is complex, but we're helping make it simple.
Find out whether Marubeni is potentially over or undervalued by checking out our comprehensive analysis, which includes fair value estimates, risks and warnings, dividends, insider transactions and financial health.
View the Free AnalysisHave feedback on this article? Concerned about the content? Get in touch with us directly. Alternatively, email editorial-team (at) simplywallst.com.
This article by Simply Wall St is general in nature. We provide commentary based on historical data and analyst forecasts only using an unbiased methodology and our articles are not intended to be financial advice. It does not constitute a recommendation to buy or sell any stock, and does not take account of your objectives, or your financial situation. We aim to bring you long-term focused analysis driven by fundamental data. Note that our analysis may not factor in the latest price-sensitive company announcements or qualitative material. Simply Wall St has no position in any stocks mentioned.
Valuation is complex, but we're helping make it simple.
Find out whether Marubeni is potentially over or undervalued by checking out our comprehensive analysis, which includes fair value estimates, risks and warnings, dividends, insider transactions and financial health.
View the Free AnalysisHave feedback on this article? Concerned about the content? Get in touch with us directly. Alternatively, email editorial-team@simplywallst.com
About TSE:8002
Marubeni
Marubeni Corporation purchases, distributes, and markets industrial and consumer goods.
Adequate balance sheet average dividend payer.
