
Advertisement
If you're looking for a multi-bagger, there's a few things to keep an eye out for. Ideally, a business will show two trends; firstly a growing return on capital employed (ROCE) and secondly, an increasing amount of capital employed. Ultimately, this demonstrates that it's a business that is reinvesting profits at increasing rates of return. Although, when we looked at Nidec (TSE:6594), it didn't seem to tick all of these boxes.
Understanding Return On Capital Employed (ROCE)
Just to clarify if you're unsure, ROCE is a metric for evaluating how much pre-tax income (in percentage terms) a company earns on the capital invested in its business. The formula for this calculation on Nidec is:
Return on Capital Employed = Earnings Before Interest and Tax (EBIT) ÷ (Total Assets - Current Liabilities)
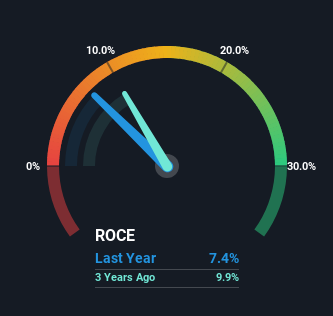
0.074 = JP¥163b ÷ (JP¥3.2t - JP¥957b) (Based on the trailing twelve months to March 2024).
Therefore, Nidec has an ROCE of 7.4%. In absolute terms, that's a low return but it's around the Electrical industry average of 9.0%.
Check out our latest analysis for Nidec
Above you can see how the current ROCE for Nidec compares to its prior returns on capital, but there's only so much you can tell from the past. If you're interested, you can view the analysts predictions in our free analyst report for Nidec .
The Trend Of ROCE
In terms of Nidec's historical ROCE movements, the trend isn't fantastic. Around five years ago the returns on capital were 9.7%, but since then they've fallen to 7.4%. However it looks like Nidec might be reinvesting for long term growth because while capital employed has increased, the company's sales haven't changed much in the last 12 months. It's worth keeping an eye on the company's earnings from here on to see if these investments do end up contributing to the bottom line.
The Bottom Line
To conclude, we've found that Nidec is reinvesting in the business, but returns have been falling. And with the stock having returned a mere 2.0% in the last five years to shareholders, you could argue that they're aware of these lackluster trends. So if you're looking for a multi-bagger, the underlying trends indicate you may have better chances elsewhere.
While Nidec doesn't shine too bright in this respect, it's still worth seeing if the company is trading at attractive prices. You can find that out with our FREE intrinsic value estimation for 6594 on our platform.
If you want to search for solid companies with great earnings, check out this free list of companies with good balance sheets and impressive returns on equity.
Valuation is complex, but we're here to simplify it.
Discover if Nidec might be undervalued or overvalued with our detailed analysis, featuring fair value estimates, potential risks, dividends, insider trades, and its financial condition.
Access Free AnalysisHave feedback on this article? Concerned about the content? Get in touch with us directly. Alternatively, email editorial-team (at) simplywallst.com.
This article by Simply Wall St is general in nature. We provide commentary based on historical data and analyst forecasts only using an unbiased methodology and our articles are not intended to be financial advice. It does not constitute a recommendation to buy or sell any stock, and does not take account of your objectives, or your financial situation. We aim to bring you long-term focused analysis driven by fundamental data. Note that our analysis may not factor in the latest price-sensitive company announcements or qualitative material. Simply Wall St has no position in any stocks mentioned.
About TSE:6594
Nidec
Develops, manufactures, and sells motors, electronics and optical components, and other related products in Japan and internationally.
Flawless balance sheet with solid track record.
Similar Companies
Market Insights

Advertisement
Community Narratives
MicroVision will explode future revenue by 380.37% with a vision towards success
Fair Value US$60.00|98.4% undervalued
TH
Community Contributor
The Indispensable Artery for a New North American Economy
Fair Value CA$132.87|1.3% undervalued
TI
Community Contributor