
Advertisement
Is Hoshizaki Corporation (TSE:6465) Worth JP¥6.3k Based On Its Intrinsic Value?
Key Insights
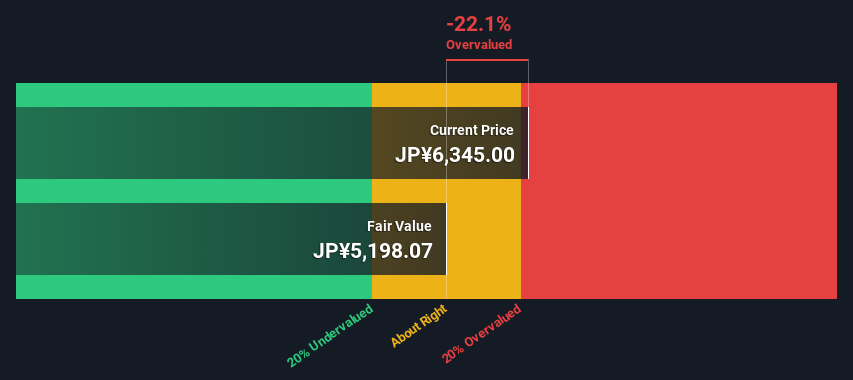
- The projected fair value for Hoshizaki is JP¥5,198 based on 2 Stage Free Cash Flow to Equity
- Hoshizaki is estimated to be 22% overvalued based on current share price of JP¥6,345
- Our fair value estimate is 23% lower than Hoshizaki's analyst price target of JP¥6,734
Does the April share price for Hoshizaki Corporation (TSE:6465) reflect what it's really worth? Today, we will estimate the stock's intrinsic value by estimating the company's future cash flows and discounting them to their present value. This will be done using the Discounted Cash Flow (DCF) model. Models like these may appear beyond the comprehension of a lay person, but they're fairly easy to follow.
We would caution that there are many ways of valuing a company and, like the DCF, each technique has advantages and disadvantages in certain scenarios. If you still have some burning questions about this type of valuation, take a look at the Simply Wall St analysis model.
We check all companies for important risks. See what we found for Hoshizaki in our free report.Crunching The Numbers
We use what is known as a 2-stage model, which simply means we have two different periods of growth rates for the company's cash flows. Generally the first stage is higher growth, and the second stage is a lower growth phase. In the first stage we need to estimate the cash flows to the business over the next ten years. Where possible we use analyst estimates, but when these aren't available we extrapolate the previous free cash flow (FCF) from the last estimate or reported value. We assume companies with shrinking free cash flow will slow their rate of shrinkage, and that companies with growing free cash flow will see their growth rate slow, over this period. We do this to reflect that growth tends to slow more in the early years than it does in later years.
A DCF is all about the idea that a dollar in the future is less valuable than a dollar today, so we need to discount the sum of these future cash flows to arrive at a present value estimate:
10-year free cash flow (FCF) forecast
| 2025 | 2026 | 2027 | 2028 | 2029 | 2030 | 2031 | 2032 | 2033 | 2034 | |
| Levered FCF (¥, Millions) | JP¥33.0b | JP¥29.9b | JP¥39.4b | JP¥39.5b | JP¥39.6b | JP¥39.7b | JP¥39.8b | JP¥39.9b | JP¥40.0b | JP¥40.2b |
| Growth Rate Estimate Source | Analyst x3 | Analyst x4 | Analyst x2 | Est @ 0.17% | Est @ 0.23% | Est @ 0.27% | Est @ 0.30% | Est @ 0.32% | Est @ 0.34% | Est @ 0.35% |
| Present Value (¥, Millions) Discounted @ 5.6% | JP¥31.3k | JP¥26.8k | JP¥33.5k | JP¥31.8k | JP¥30.2k | JP¥28.7k | JP¥27.2k | JP¥25.9k | JP¥24.6k | JP¥23.4k |
("Est" = FCF growth rate estimated by Simply Wall St)
Present Value of 10-year Cash Flow (PVCF) = JP¥283b
We now need to calculate the Terminal Value, which accounts for all the future cash flows after this ten year period. The Gordon Growth formula is used to calculate Terminal Value at a future annual growth rate equal to the 5-year average of the 10-year government bond yield of 0.4%. We discount the terminal cash flows to today's value at a cost of equity of 5.6%.
Terminal Value (TV)= FCF2034 × (1 + g) ÷ (r – g) = JP¥40b× (1 + 0.4%) ÷ (5.6%– 0.4%) = JP¥776b
Present Value of Terminal Value (PVTV)= TV / (1 + r)10= JP¥776b÷ ( 1 + 5.6%)10= JP¥451b
The total value, or equity value, is then the sum of the present value of the future cash flows, which in this case is JP¥735b. In the final step we divide the equity value by the number of shares outstanding. Relative to the current share price of JP¥6.3k, the company appears slightly overvalued at the time of writing. Remember though, that this is just an approximate valuation, and like any complex formula - garbage in, garbage out.
Important Assumptions
The calculation above is very dependent on two assumptions. The first is the discount rate and the other is the cash flows. If you don't agree with these result, have a go at the calculation yourself and play with the assumptions. The DCF also does not consider the possible cyclicality of an industry, or a company's future capital requirements, so it does not give a full picture of a company's potential performance. Given that we are looking at Hoshizaki as potential shareholders, the cost of equity is used as the discount rate, rather than the cost of capital (or weighted average cost of capital, WACC) which accounts for debt. In this calculation we've used 5.6%, which is based on a levered beta of 0.986. Beta is a measure of a stock's volatility, compared to the market as a whole. We get our beta from the industry average beta of globally comparable companies, with an imposed limit between 0.8 and 2.0, which is a reasonable range for a stable business.
Check out our latest analysis for Hoshizaki
SWOT Analysis for Hoshizaki
Strength
- Earnings growth over the past year exceeded the industry.
- Currently debt free.
- Dividends are covered by earnings and cash flows.
Weakness
- Earnings growth over the past year is below its 5-year average.
- Dividend is low compared to the top 25% of dividend payers in the Machinery market.
- Expensive based on P/E ratio and estimated fair value.
Opportunity
- Annual earnings are forecast to grow faster than the Japanese market.
Threat
- Revenue is forecast to grow slower than 20% per year.
Looking Ahead:
Whilst important, the DCF calculation is only one of many factors that you need to assess for a company. It's not possible to obtain a foolproof valuation with a DCF model. Rather it should be seen as a guide to "what assumptions need to be true for this stock to be under/overvalued?" For example, changes in the company's cost of equity or the risk free rate can significantly impact the valuation. What is the reason for the share price exceeding the intrinsic value? For Hoshizaki, we've compiled three essential aspects you should further examine:
- Financial Health: Does 6465 have a healthy balance sheet? Take a look at our free balance sheet analysis with six simple checks on key factors like leverage and risk.
- Future Earnings: How does 6465's growth rate compare to its peers and the wider market? Dig deeper into the analyst consensus number for the upcoming years by interacting with our free analyst growth expectation chart.
- Other Solid Businesses: Low debt, high returns on equity and good past performance are fundamental to a strong business. Why not explore our interactive list of stocks with solid business fundamentals to see if there are other companies you may not have considered!
PS. Simply Wall St updates its DCF calculation for every Japanese stock every day, so if you want to find the intrinsic value of any other stock just search here.
Valuation is complex, but we're here to simplify it.
Discover if Hoshizaki might be undervalued or overvalued with our detailed analysis, featuring fair value estimates, potential risks, dividends, insider trades, and its financial condition.
Access Free AnalysisHave feedback on this article? Concerned about the content? Get in touch with us directly. Alternatively, email editorial-team (at) simplywallst.com.
This article by Simply Wall St is general in nature. We provide commentary based on historical data and analyst forecasts only using an unbiased methodology and our articles are not intended to be financial advice. It does not constitute a recommendation to buy or sell any stock, and does not take account of your objectives, or your financial situation. We aim to bring you long-term focused analysis driven by fundamental data. Note that our analysis may not factor in the latest price-sensitive company announcements or qualitative material. Simply Wall St has no position in any stocks mentioned.
About TSE:6465
Hoshizaki
Researches, develops, manufactures, and sells commercial kitchen appliances and equipment worldwide.
Solid track record with excellent balance sheet and pays a dividend.
Similar Companies
Market Insights

Advertisement
Community Narratives
The company that turned a verb into a global necessity and basically runs the modern internet, digital ads, smartphones, maps, and AI.
Fair Value US$300.00|7.5% undervalued
OS
Community Contributor
Flowers Foods Pays A Fair Price For Health
Fair Value US$16.12|25.4% undervalued
NV
Community Contributor
TMX Group will thrive with 33.3% profit margin and enduring market moat
Fair Value CA$49.90|3.6% overvalued
LI
Community Contributor
The "Molecular Pencil": Why Beam's Technology is Built to Win
Fair Value US$65.01|65.0% undervalued
DA
Community Contributor