
Advertisement
Tsubakimoto Chain Co.'s (TSE:6371) Share Price Could Signal Some Risk
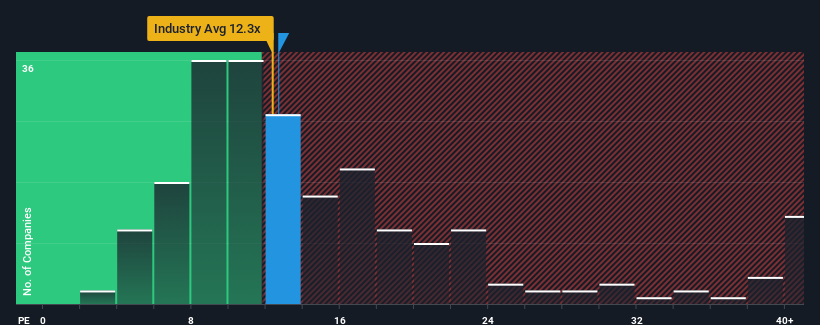
With a median price-to-earnings (or "P/E") ratio of close to 14x in Japan, you could be forgiven for feeling indifferent about Tsubakimoto Chain Co.'s (TSE:6371) P/E ratio of 12.7x. Although, it's not wise to simply ignore the P/E without explanation as investors may be disregarding a distinct opportunity or a costly mistake.
Recent times haven't been advantageous for Tsubakimoto Chain as its earnings have been rising slower than most other companies. One possibility is that the P/E is moderate because investors think this lacklustre earnings performance will turn around. You'd really hope so, otherwise you're paying a relatively elevated price for a company with this sort of growth profile.
See our latest analysis for Tsubakimoto Chain
Does Growth Match The P/E?
The only time you'd be comfortable seeing a P/E like Tsubakimoto Chain's is when the company's growth is tracking the market closely.
If we review the last year of earnings, the company posted a result that saw barely any deviation from a year ago. However, a few strong years before that means that it was still able to grow EPS by an impressive 116% in total over the last three years. Accordingly, shareholders would have probably welcomed those medium-term rates of earnings growth.
Shifting to the future, estimates from the three analysts covering the company suggest earnings should grow by 4.4% each year over the next three years. That's shaping up to be materially lower than the 11% per year growth forecast for the broader market.
In light of this, it's curious that Tsubakimoto Chain's P/E sits in line with the majority of other companies. It seems most investors are ignoring the fairly limited growth expectations and are willing to pay up for exposure to the stock. These shareholders may be setting themselves up for future disappointment if the P/E falls to levels more in line with the growth outlook.
The Bottom Line On Tsubakimoto Chain's P/E
It's argued the price-to-earnings ratio is an inferior measure of value within certain industries, but it can be a powerful business sentiment indicator.
We've established that Tsubakimoto Chain currently trades on a higher than expected P/E since its forecast growth is lower than the wider market. Right now we are uncomfortable with the P/E as the predicted future earnings aren't likely to support a more positive sentiment for long. This places shareholders' investments at risk and potential investors in danger of paying an unnecessary premium.
The company's balance sheet is another key area for risk analysis. You can assess many of the main risks through our free balance sheet analysis for Tsubakimoto Chain with six simple checks.
If you're unsure about the strength of Tsubakimoto Chain's business, why not explore our interactive list of stocks with solid business fundamentals for some other companies you may have missed.
Valuation is complex, but we're here to simplify it.
Discover if Tsubakimoto Chain might be undervalued or overvalued with our detailed analysis, featuring fair value estimates, potential risks, dividends, insider trades, and its financial condition.
Access Free AnalysisHave feedback on this article? Concerned about the content? Get in touch with us directly. Alternatively, email editorial-team (at) simplywallst.com.
This article by Simply Wall St is general in nature. We provide commentary based on historical data and analyst forecasts only using an unbiased methodology and our articles are not intended to be financial advice. It does not constitute a recommendation to buy or sell any stock, and does not take account of your objectives, or your financial situation. We aim to bring you long-term focused analysis driven by fundamental data. Note that our analysis may not factor in the latest price-sensitive company announcements or qualitative material. Simply Wall St has no position in any stocks mentioned.
About TSE:6371
Tsubakimoto Chain
Manufactures and sells chains, motion control, mobility, materials handling systems components in Japan.
Flawless balance sheet 6 star dividend payer.
Market Insights


Advertisement
Community Narratives
The Next Phase of Energy Storage: How NeoVolta Is Tackling America’s Power Crunch
Fair Value US$7.50|39.3% undervalued
MA
Community Contributor
Why EnSilica is Worth Possibly 13x its Current Price
Fair Value UK£5.00|91.8% undervalued
DO
Community Contributor
A case for Cassiar Gold Corp (TSXV: GLDC) to reach CAD$8-10 before 2030 (X30-37)
Fair Value CA$10.00|97.4% undervalued
AG
Community Contributor
M&A Activity, Industry Diversification & A Defense Contract Monopoly Will Push BWXT For Healthy Long-Term Growth
Fair Value US$220.00|17.3% undervalued
CL
Community Contributor