
Advertisement
We Like These Underlying Return On Capital Trends At Ebara (TSE:6361)
Finding a business that has the potential to grow substantially is not easy, but it is possible if we look at a few key financial metrics. Amongst other things, we'll want to see two things; firstly, a growing return on capital employed (ROCE) and secondly, an expansion in the company's amount of capital employed. If you see this, it typically means it's a company with a great business model and plenty of profitable reinvestment opportunities. Speaking of which, we noticed some great changes in Ebara's (TSE:6361) returns on capital, so let's have a look.
Understanding Return On Capital Employed (ROCE)
For those who don't know, ROCE is a measure of a company's yearly pre-tax profit (its return), relative to the capital employed in the business. The formula for this calculation on Ebara is:
Return on Capital Employed = Earnings Before Interest and Tax (EBIT) ÷ (Total Assets - Current Liabilities)
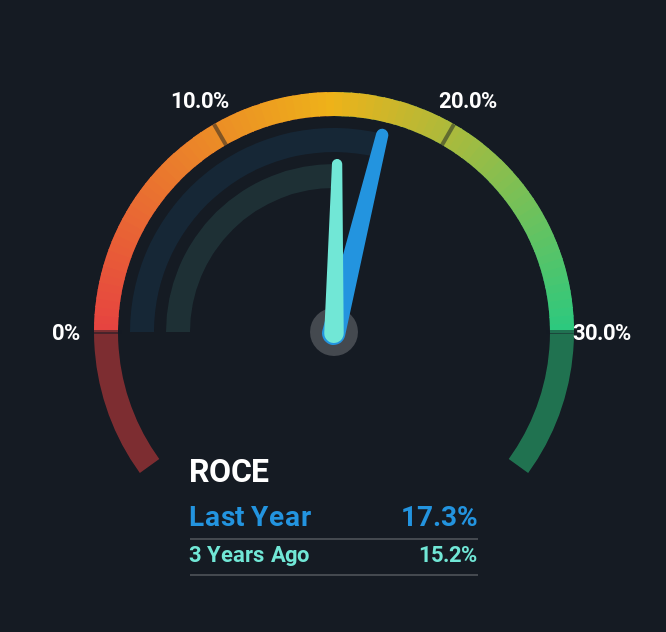
0.17 = JP¥101b ÷ (JP¥1.0t - JP¥416b) (Based on the trailing twelve months to March 2025).
Therefore, Ebara has an ROCE of 17%. On its own, that's a standard return, however it's much better than the 8.2% generated by the Machinery industry.
View our latest analysis for Ebara
In the above chart we have measured Ebara's prior ROCE against its prior performance, but the future is arguably more important. If you'd like to see what analysts are forecasting going forward, you should check out our free analyst report for Ebara .
What Can We Tell From Ebara's ROCE Trend?
We like the trends that we're seeing from Ebara. The data shows that returns on capital have increased substantially over the last five years to 17%. The amount of capital employed has increased too, by 81%. So we're very much inspired by what we're seeing at Ebara thanks to its ability to profitably reinvest capital.
Another thing to note, Ebara has a high ratio of current liabilities to total assets of 42%. This effectively means that suppliers (or short-term creditors) are funding a large portion of the business, so just be aware that this can introduce some elements of risk. While it's not necessarily a bad thing, it can be beneficial if this ratio is lower.
Our Take On Ebara's ROCE
In summary, it's great to see that Ebara can compound returns by consistently reinvesting capital at increasing rates of return, because these are some of the key ingredients of those highly sought after multi-baggers. And with the stock having performed exceptionally well over the last five years, these patterns are being accounted for by investors. Therefore, we think it would be worth your time to check if these trends are going to continue.
If you want to continue researching Ebara, you might be interested to know about the 1 warning sign that our analysis has discovered.
For those who like to invest in solid companies, check out this free list of companies with solid balance sheets and high returns on equity.
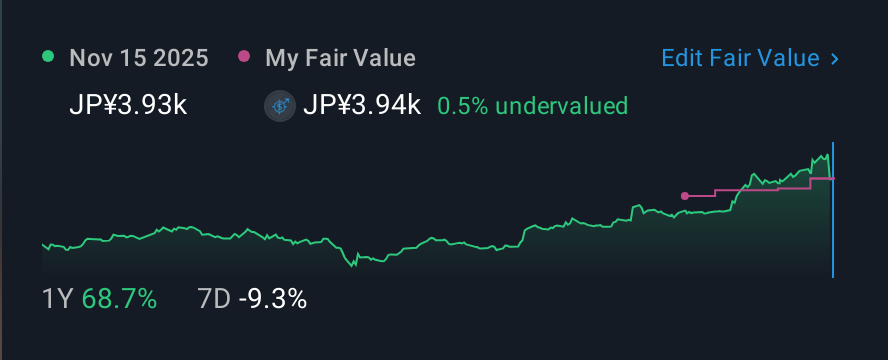
Valuation is complex, but we're here to simplify it.
Discover if Ebara might be undervalued or overvalued with our detailed analysis, featuring fair value estimates, potential risks, dividends, insider trades, and its financial condition.
Access Free AnalysisHave feedback on this article? Concerned about the content? Get in touch with us directly. Alternatively, email editorial-team (at) simplywallst.com.
This article by Simply Wall St is general in nature. We provide commentary based on historical data and analyst forecasts only using an unbiased methodology and our articles are not intended to be financial advice. It does not constitute a recommendation to buy or sell any stock, and does not take account of your objectives, or your financial situation. We aim to bring you long-term focused analysis driven by fundamental data. Note that our analysis may not factor in the latest price-sensitive company announcements or qualitative material. Simply Wall St has no position in any stocks mentioned.
About TSE:6361
Ebara
Manufactures and sells pumps, compressors, turbines, and chillers in Europe, the Middle East, Africa, Asia, Japan, Oceania, North America, and Central and South America.
Flawless balance sheet with limited growth.
Similar Companies
Market Insights

Advertisement
Community Narratives
MINISO's fair value is projected at 26.69 with an anticipated PE ratio shift of 20x
Fair Value US$24.03|11.0% undervalued
BE
Community Contributor
Procter & Gamble: A Dividend Giant Facing Slowing Growth
Fair Value US$119.81|23.3% overvalued
AN
Community Contributor
Eli Lilly's Future Growth Driven by Tirzepatide and Favorable Market Conditions
Fair Value US$1.19k|13.8% undervalued
EA
Community Contributor