Stock Analysis
Is Weakness In Ebara Corporation (TSE:6361) Stock A Sign That The Market Could be Wrong Given Its Strong Financial Prospects?


Ebara (TSE:6361) has had a rough month with its share price down 7.6%. However, stock prices are usually driven by a company’s financial performance over the long term, which in this case looks quite promising. In this article, we decided to focus on Ebara's ROE.
Return on equity or ROE is a key measure used to assess how efficiently a company's management is utilizing the company's capital. In simpler terms, it measures the profitability of a company in relation to shareholder's equity.
See our latest analysis for Ebara
How Do You Calculate Return On Equity?
ROE can be calculated by using the formula:
Return on Equity = Net Profit (from continuing operations) ÷ Shareholders' Equity
So, based on the above formula, the ROE for Ebara is:
16% = JP¥70b ÷ JP¥434b (Based on the trailing twelve months to March 2024).
The 'return' is the profit over the last twelve months. That means that for every ¥1 worth of shareholders' equity, the company generated ¥0.16 in profit.
What Has ROE Got To Do With Earnings Growth?
Thus far, we have learned that ROE measures how efficiently a company is generating its profits. We now need to evaluate how much profit the company reinvests or "retains" for future growth which then gives us an idea about the growth potential of the company. Assuming everything else remains unchanged, the higher the ROE and profit retention, the higher the growth rate of a company compared to companies that don't necessarily bear these characteristics.
A Side By Side comparison of Ebara's Earnings Growth And 16% ROE
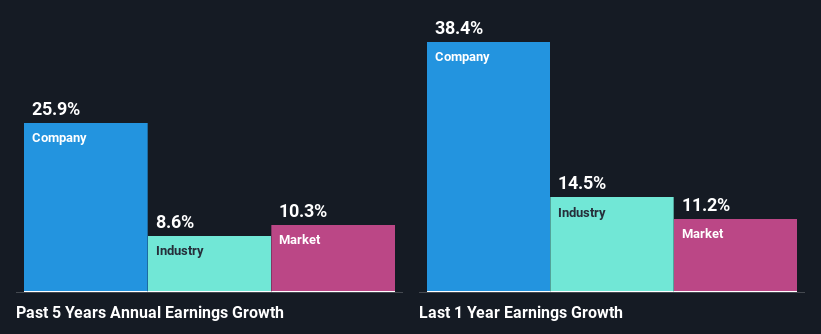
At first glance, Ebara seems to have a decent ROE. On comparing with the average industry ROE of 7.4% the company's ROE looks pretty remarkable. This probably laid the ground for Ebara's significant 26% net income growth seen over the past five years. We reckon that there could also be other factors at play here. Such as - high earnings retention or an efficient management in place.
As a next step, we compared Ebara's net income growth with the industry, and pleasingly, we found that the growth seen by the company is higher than the average industry growth of 8.6%.
Earnings growth is a huge factor in stock valuation. The investor should try to establish if the expected growth or decline in earnings, whichever the case may be, is priced in. Doing so will help them establish if the stock's future looks promising or ominous. Has the market priced in the future outlook for 6361? You can find out in our latest intrinsic value infographic research report.
Is Ebara Efficiently Re-investing Its Profits?
Ebara has a three-year median payout ratio of 35% (where it is retaining 65% of its income) which is not too low or not too high. By the looks of it, the dividend is well covered and Ebara is reinvesting its profits efficiently as evidenced by its exceptional growth which we discussed above.
Moreover, Ebara is determined to keep sharing its profits with shareholders which we infer from its long history of paying a dividend for at least ten years.
Summary
Overall, we are quite pleased with Ebara's performance. In particular, it's great to see that the company is investing heavily into its business and along with a high rate of return, that has resulted in a sizeable growth in its earnings. That being so, a study of the latest analyst forecasts show that the company is expected to see a slowdown in its future earnings growth. To know more about the company's future earnings growth forecasts take a look at this free report on analyst forecasts for the company to find out more.
Valuation is complex, but we're helping make it simple.
Find out whether Ebara is potentially over or undervalued by checking out our comprehensive analysis, which includes fair value estimates, risks and warnings, dividends, insider transactions and financial health.
View the Free AnalysisHave feedback on this article? Concerned about the content? Get in touch with us directly. Alternatively, email editorial-team (at) simplywallst.com.
This article by Simply Wall St is general in nature. We provide commentary based on historical data and analyst forecasts only using an unbiased methodology and our articles are not intended to be financial advice. It does not constitute a recommendation to buy or sell any stock, and does not take account of your objectives, or your financial situation. We aim to bring you long-term focused analysis driven by fundamental data. Note that our analysis may not factor in the latest price-sensitive company announcements or qualitative material. Simply Wall St has no position in any stocks mentioned.
About TSE:6361
Solid track record with excellent balance sheet and pays a dividend.
