Stock Analysis
- Japan
- /
- Professional Services
- /
- TSE:2175
After losing 37% in the past year, SMS Co., Ltd. (TSE:2175) institutional owners must be relieved by the recent gain


Key Insights
- Given the large stake in the stock by institutions, SMS' stock price might be vulnerable to their trading decisions
- The top 17 shareholders own 51% of the company
- Insider ownership in SMS is 18%
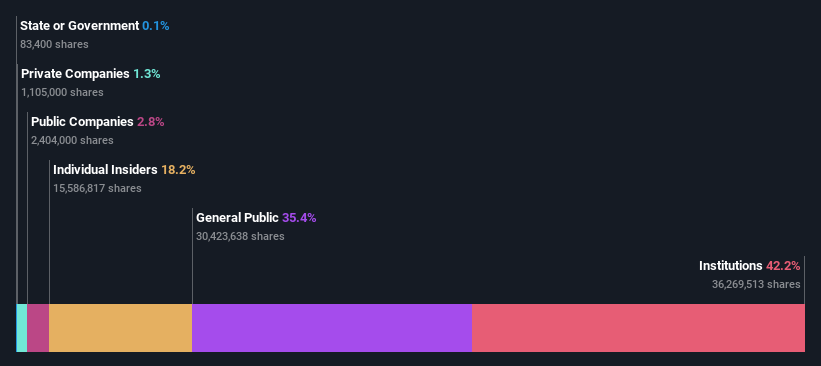
If you want to know who really controls SMS Co., Ltd. (TSE:2175), then you'll have to look at the makeup of its share registry. We can see that institutions own the lion's share in the company with 42% ownership. In other words, the group stands to gain the most (or lose the most) from their investment into the company.
Last week's JP¥8.8b market cap gain would probably be appreciated by institutional investors, especially after a year of 37% losses.
Let's delve deeper into each type of owner of SMS, beginning with the chart below.
Check out our latest analysis for SMS
What Does The Institutional Ownership Tell Us About SMS?
Many institutions measure their performance against an index that approximates the local market. So they usually pay more attention to companies that are included in major indices.
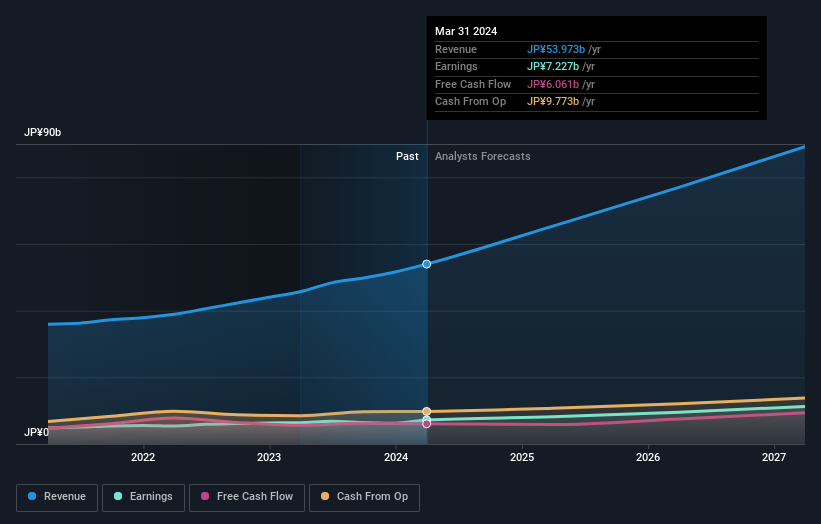
As you can see, institutional investors have a fair amount of stake in SMS. This can indicate that the company has a certain degree of credibility in the investment community. However, it is best to be wary of relying on the supposed validation that comes with institutional investors. They too, get it wrong sometimes. When multiple institutions own a stock, there's always a risk that they are in a 'crowded trade'. When such a trade goes wrong, multiple parties may compete to sell stock fast. This risk is higher in a company without a history of growth. You can see SMS' historic earnings and revenue below, but keep in mind there's always more to the story.
Hedge funds don't have many shares in SMS. Our data shows that Shuhei Morofuji is the largest shareholder with 18% of shares outstanding. With 6.3% and 2.8% of the shares outstanding respectively, Nomura Asset Management Co., Ltd. and AS ONE Corporation are the second and third largest shareholders.
A closer look at our ownership figures suggests that the top 17 shareholders have a combined ownership of 51% implying that no single shareholder has a majority.
Researching institutional ownership is a good way to gauge and filter a stock's expected performance. The same can be achieved by studying analyst sentiments. There are a reasonable number of analysts covering the stock, so it might be useful to find out their aggregate view on the future.
Insider Ownership Of SMS
While the precise definition of an insider can be subjective, almost everyone considers board members to be insiders. The company management answer to the board and the latter should represent the interests of shareholders. Notably, sometimes top-level managers are on the board themselves.
I generally consider insider ownership to be a good thing. However, on some occasions it makes it more difficult for other shareholders to hold the board accountable for decisions.
It seems insiders own a significant proportion of SMS Co., Ltd.. Insiders own JP¥32b worth of shares in the JP¥175b company. That's quite meaningful. Most would be pleased to see the board is investing alongside them. You may wish to access this free chart showing recent trading by insiders.
General Public Ownership
The general public-- including retail investors -- own 35% stake in the company, and hence can't easily be ignored. While this group can't necessarily call the shots, it can certainly have a real influence on how the company is run.
Next Steps:
It's always worth thinking about the different groups who own shares in a company. But to understand SMS better, we need to consider many other factors.
I like to dive deeper into how a company has performed in the past. You can access this interactive graph of past earnings, revenue and cash flow, for free.
If you would prefer discover what analysts are predicting in terms of future growth, do not miss this free report on analyst forecasts.
NB: Figures in this article are calculated using data from the last twelve months, which refer to the 12-month period ending on the last date of the month the financial statement is dated. This may not be consistent with full year annual report figures.
Valuation is complex, but we're helping make it simple.
Find out whether SMS is potentially over or undervalued by checking out our comprehensive analysis, which includes fair value estimates, risks and warnings, dividends, insider transactions and financial health.
View the Free AnalysisHave feedback on this article? Concerned about the content? Get in touch with us directly. Alternatively, email editorial-team (at) simplywallst.com.
This article by Simply Wall St is general in nature. We provide commentary based on historical data and analyst forecasts only using an unbiased methodology and our articles are not intended to be financial advice. It does not constitute a recommendation to buy or sell any stock, and does not take account of your objectives, or your financial situation. We aim to bring you long-term focused analysis driven by fundamental data. Note that our analysis may not factor in the latest price-sensitive company announcements or qualitative material. Simply Wall St has no position in any stocks mentioned.
Valuation is complex, but we're helping make it simple.
Find out whether SMS is potentially over or undervalued by checking out our comprehensive analysis, which includes fair value estimates, risks and warnings, dividends, insider transactions and financial health.
View the Free AnalysisHave feedback on this article? Concerned about the content? Get in touch with us directly. Alternatively, email editorial-team@simplywallst.com
About TSE:2175
SMS
Provides information infrastructure for the nursing care, medical care, career, healthcare, and elderly care field business areas in Japan and internationally.
Flawless balance sheet with proven track record.
