
Advertisement
The Market Lifts Iseki & Co., Ltd. (TSE:6310) Shares 27% But It Can Do More
Iseki & Co., Ltd. (TSE:6310) shares have continued their recent momentum with a 27% gain in the last month alone. The last 30 days bring the annual gain to a very sharp 88%.
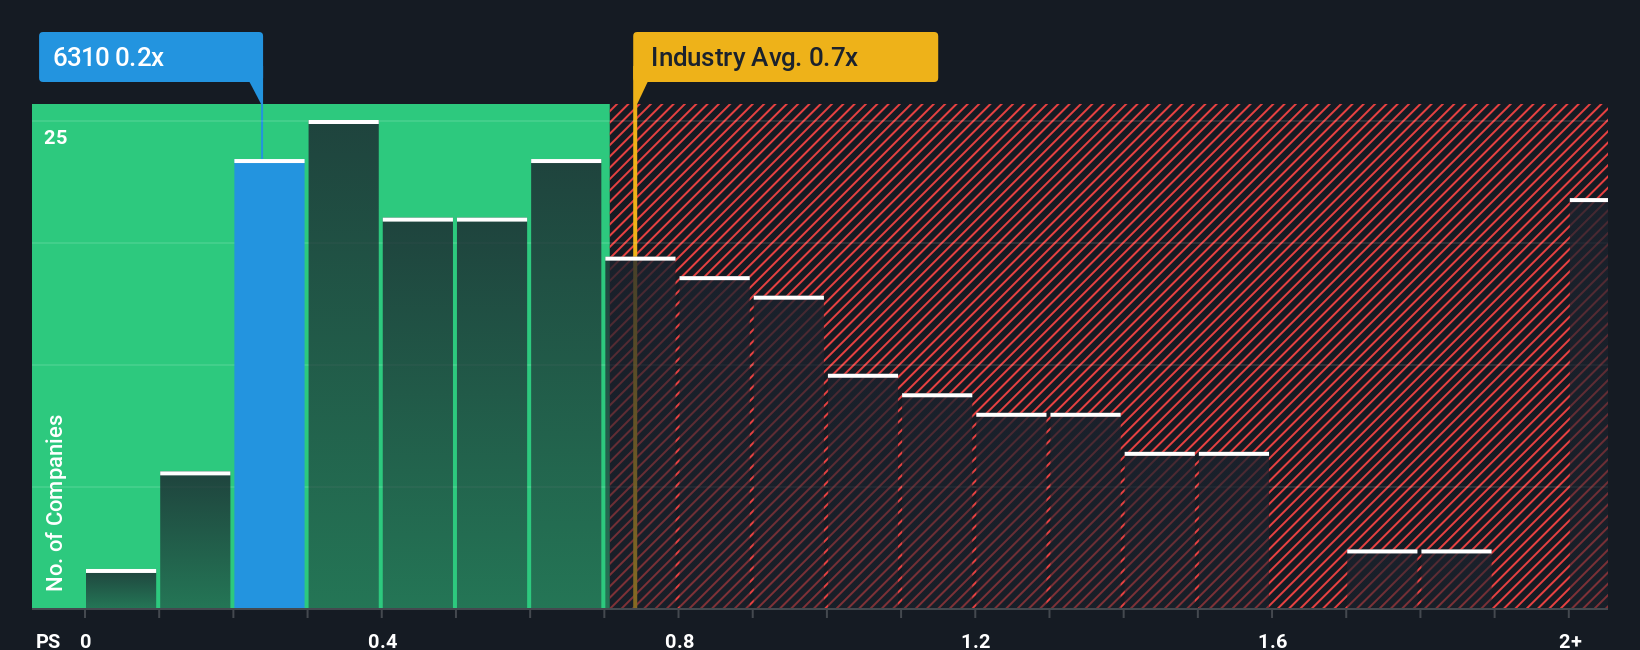
Although its price has surged higher, it would still be understandable if you think Iseki is a stock with good investment prospects with a price-to-sales ratios (or "P/S") of 0.2x, considering almost half the companies in Japan's Machinery industry have P/S ratios above 0.7x. Nonetheless, we'd need to dig a little deeper to determine if there is a rational basis for the reduced P/S.
See our latest analysis for Iseki
What Does Iseki's Recent Performance Look Like?
We'd have to say that with no tangible growth over the last year, Iseki's revenue has been unimpressive. Perhaps the market believes the recent lacklustre revenue performance is a sign of future underperformance relative to industry peers, hurting the P/S. Those who are bullish on Iseki will be hoping that this isn't the case, so that they can pick up the stock at a lower valuation.
Although there are no analyst estimates available for Iseki, take a look at this free data-rich visualisation to see how the company stacks up on earnings, revenue and cash flow.Is There Any Revenue Growth Forecasted For Iseki?
In order to justify its P/S ratio, Iseki would need to produce sluggish growth that's trailing the industry.
Taking a look back first, we see that there was hardly any revenue growth to speak of for the company over the past year. Regardless, revenue has managed to lift by a handy 9.0% in aggregate from three years ago, thanks to the earlier period of growth. Accordingly, shareholders probably wouldn't have been overly satisfied with the unstable medium-term growth rates.
It's interesting to note that the rest of the industry is similarly expected to grow by 4.6% over the next year, which is fairly even with the company's recent medium-term annualised growth rates.
With this in consideration, we find it intriguing that Iseki's P/S falls short of its industry peers. It may be that most investors are not convinced the company can maintain recent growth rates.
What Does Iseki's P/S Mean For Investors?
The latest share price surge wasn't enough to lift Iseki's P/S close to the industry median. Typically, we'd caution against reading too much into price-to-sales ratios when settling on investment decisions, though it can reveal plenty about what other market participants think about the company.
Our examination of Iseki revealed its three-year revenue trends looking similar to current industry expectations hasn't given the P/S the boost we expected, given that it's lower than the wider industry P/S, When we see industry-like revenue growth but a lower than expected P/S, we assume potential risks are what might be placing downward pressure on the share price. At least the risk of a price drop looks to be subdued if recent medium-term revenue trends continue, but investors seem to think future revenue could see some volatility.
And what about other risks? Every company has them, and we've spotted 3 warning signs for Iseki (of which 2 can't be ignored!) you should know about.
If these risks are making you reconsider your opinion on Iseki, explore our interactive list of high quality stocks to get an idea of what else is out there.
New: AI Stock Screener & Alerts
Our new AI Stock Screener scans the market every day to uncover opportunities.
• Dividend Powerhouses (3%+ Yield)
• Undervalued Small Caps with Insider Buying
• High growth Tech and AI Companies
Or build your own from over 50 metrics.
Have feedback on this article? Concerned about the content? Get in touch with us directly. Alternatively, email editorial-team (at) simplywallst.com.
This article by Simply Wall St is general in nature. We provide commentary based on historical data and analyst forecasts only using an unbiased methodology and our articles are not intended to be financial advice. It does not constitute a recommendation to buy or sell any stock, and does not take account of your objectives, or your financial situation. We aim to bring you long-term focused analysis driven by fundamental data. Note that our analysis may not factor in the latest price-sensitive company announcements or qualitative material. Simply Wall St has no position in any stocks mentioned.
About TSE:6310
Iseki
Engages in the development, manufacture, and sale of agricultural machinery in Japan, Asia, Europe, North America, and internationally.
Excellent balance sheet with moderate growth potential.
Similar Companies
Market Insights

Advertisement
Community Narratives
The company that turned a verb into a global necessity and basically runs the modern internet, digital ads, smartphones, maps, and AI.
Fair Value US$300.00|5.4% undervalued
OS
Community Contributor
Flowers Foods Pays A Fair Price For Health
Fair Value US$16.12|26.3% undervalued
NV
Community Contributor
TMX Group will thrive with 33.3% profit margin and enduring market moat
Fair Value CA$49.90|4.1% overvalued
LI
Community Contributor
The "Molecular Pencil": Why Beam's Technology is Built to Win
Fair Value US$65.01|62.7% undervalued
DA
Community Contributor