
Advertisement
Investors Appear Satisfied With Union Tool Co.'s (TSE:6278) Prospects As Shares Rocket 28%
Union Tool Co. (TSE:6278) shareholders have had their patience rewarded with a 28% share price jump in the last month. The last 30 days bring the annual gain to a very sharp 26%.
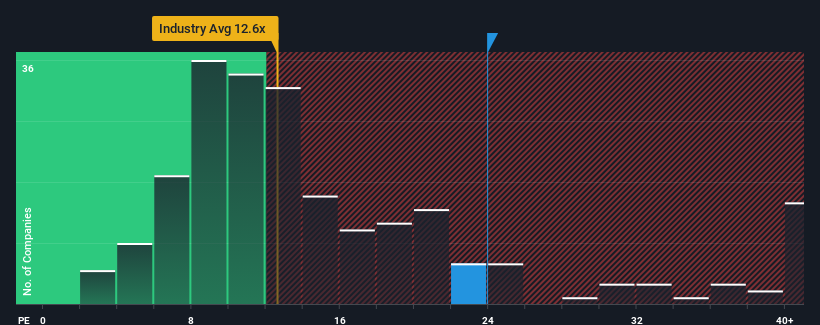
Following the firm bounce in price, Union Tool may be sending very bearish signals at the moment with a price-to-earnings (or "P/E") ratio of 23.9x, since almost half of all companies in Japan have P/E ratios under 14x and even P/E's lower than 9x are not unusual. Nonetheless, we'd need to dig a little deeper to determine if there is a rational basis for the highly elevated P/E.
While the market has experienced earnings growth lately, Union Tool's earnings have gone into reverse gear, which is not great. It might be that many expect the dour earnings performance to recover substantially, which has kept the P/E from collapsing. You'd really hope so, otherwise you're paying a pretty hefty price for no particular reason.
Check out our latest analysis for Union Tool
How Is Union Tool's Growth Trending?
In order to justify its P/E ratio, Union Tool would need to produce outstanding growth well in excess of the market.
If we review the last year of earnings, dishearteningly the company's profits fell to the tune of 38%. That put a dampener on the good run it was having over the longer-term as its three-year EPS growth is still a noteworthy 21% in total. So we can start by confirming that the company has generally done a good job of growing earnings over that time, even though it had some hiccups along the way.
Shifting to the future, estimates from the dual analysts covering the company suggest earnings should grow by 13% per annum over the next three years. Meanwhile, the rest of the market is forecast to only expand by 10% each year, which is noticeably less attractive.
In light of this, it's understandable that Union Tool's P/E sits above the majority of other companies. It seems most investors are expecting this strong future growth and are willing to pay more for the stock.
What We Can Learn From Union Tool's P/E?
Shares in Union Tool have built up some good momentum lately, which has really inflated its P/E. It's argued the price-to-earnings ratio is an inferior measure of value within certain industries, but it can be a powerful business sentiment indicator.
We've established that Union Tool maintains its high P/E on the strength of its forecast growth being higher than the wider market, as expected. At this stage investors feel the potential for a deterioration in earnings isn't great enough to justify a lower P/E ratio. Unless these conditions change, they will continue to provide strong support to the share price.
Before you settle on your opinion, we've discovered 1 warning sign for Union Tool that you should be aware of.
If P/E ratios interest you, you may wish to see this free collection of other companies with strong earnings growth and low P/E ratios.
New: AI Stock Screener & Alerts
Our new AI Stock Screener scans the market every day to uncover opportunities.
• Dividend Powerhouses (3%+ Yield)
• Undervalued Small Caps with Insider Buying
• High growth Tech and AI Companies
Or build your own from over 50 metrics.
Have feedback on this article? Concerned about the content? Get in touch with us directly. Alternatively, email editorial-team (at) simplywallst.com.
This article by Simply Wall St is general in nature. We provide commentary based on historical data and analyst forecasts only using an unbiased methodology and our articles are not intended to be financial advice. It does not constitute a recommendation to buy or sell any stock, and does not take account of your objectives, or your financial situation. We aim to bring you long-term focused analysis driven by fundamental data. Note that our analysis may not factor in the latest price-sensitive company announcements or qualitative material. Simply Wall St has no position in any stocks mentioned.
About TSE:6278
Union Tool
Designs, manufactures, and sells of cutting tools, linear motion products, and metal machining equipment in Japan, China, Taiwan, and internationally.
Flawless balance sheet with solid track record.
Similar Companies
Market Insights

Advertisement
Community Narratives
The company that turned a verb into a global necessity and basically runs the modern internet, digital ads, smartphones, maps, and AI.
Fair Value US$300.00|5.4% undervalued
OS
Community Contributor
Flowers Foods Pays A Fair Price For Health
Fair Value US$16.12|26.3% undervalued
NV
Community Contributor
TMX Group will thrive with 33.3% profit margin and enduring market moat
Fair Value CA$49.90|4.1% overvalued
LI
Community Contributor
The "Molecular Pencil": Why Beam's Technology is Built to Win
Fair Value US$65.01|62.7% undervalued
DA
Community Contributor