Advertisement
Has SMC’s Recent Share Slide Created a New Opportunity in 2025?

Simply Wall St
Reviewed by Simply Wall St
If you’re considering what to do with your SMC shares right now, you’re not alone. This stock has been on a rollercoaster lately, and it’s completely understandable to wonder what the best move is. SMC closed recently at 44,500, continuing a trend that’s seen the stock edge down about 1% over the past week and month. More striking is the longer-term picture: SMC is down 27.3% year to date and has lost 25.2% over the last twelve months. Even stretching out to three and five years, the stock’s performance has been negative, which may feel discouraging at a glance.
Much of this recent movement ties back to broader market sentiment and shifts in the industry landscape. Investors are rethinking what kind of risk they want to take on, and SMC’s price has reflected that changing calculation. However, if you’re gauging the true value here, headline numbers only tell part of the story.
SMC’s current value score stands at 3, based on a detailed checklist approach. In other words, the company is undervalued in 3 out of 6 key valuation checks. So, does that mean SMC deserves a fresh look from bargain hunters, or are the recent dips justified?
We’ll break down the nuts and bolts of how SMC’s valuation stacks up compared to typical measures. If you want to go even deeper, stay with us; there’s an insightful way to interpret valuation that goes beyond the usual checklists, which we’ll dive into at the end of the article.
Why SMC is lagging behind its peersApproach 1: SMC Discounted Cash Flow (DCF) Analysis
The Discounted Cash Flow (DCF) model estimates a company's true value by extrapolating its future cash flow projections and then discounting them back to the present. This approach helps investors determine what a business is really worth today based on expected cash generation.
For SMC, the latest reported Free Cash Flow is ¥101.4 billion. Analysts provide forecasted Free Cash Flow estimates for the next five years, projecting significant growth. Further out, Simply Wall St extrapolates these numbers to arrive at a ten-year projection of ¥152.5 billion in 2035. Over this period, the company's annual cash generation is expected to rise, but not at a rapid pace, reflecting both analyst expectations and modeled estimates into the next decade.
After calculating all these future flows and discounting them to today's value, the DCF model suggests SMC's intrinsic value is ¥39,697 per share. With the current share price at ¥44,500, this implies the stock is about 12.1% overvalued based on projected cash flows. In other words, the market price is ahead of what DCF fundamentals would support right now.
Result: OVERVALUED
Head to the Valuation section of our Company Report for more details on how we arrive at this Fair Value for SMC.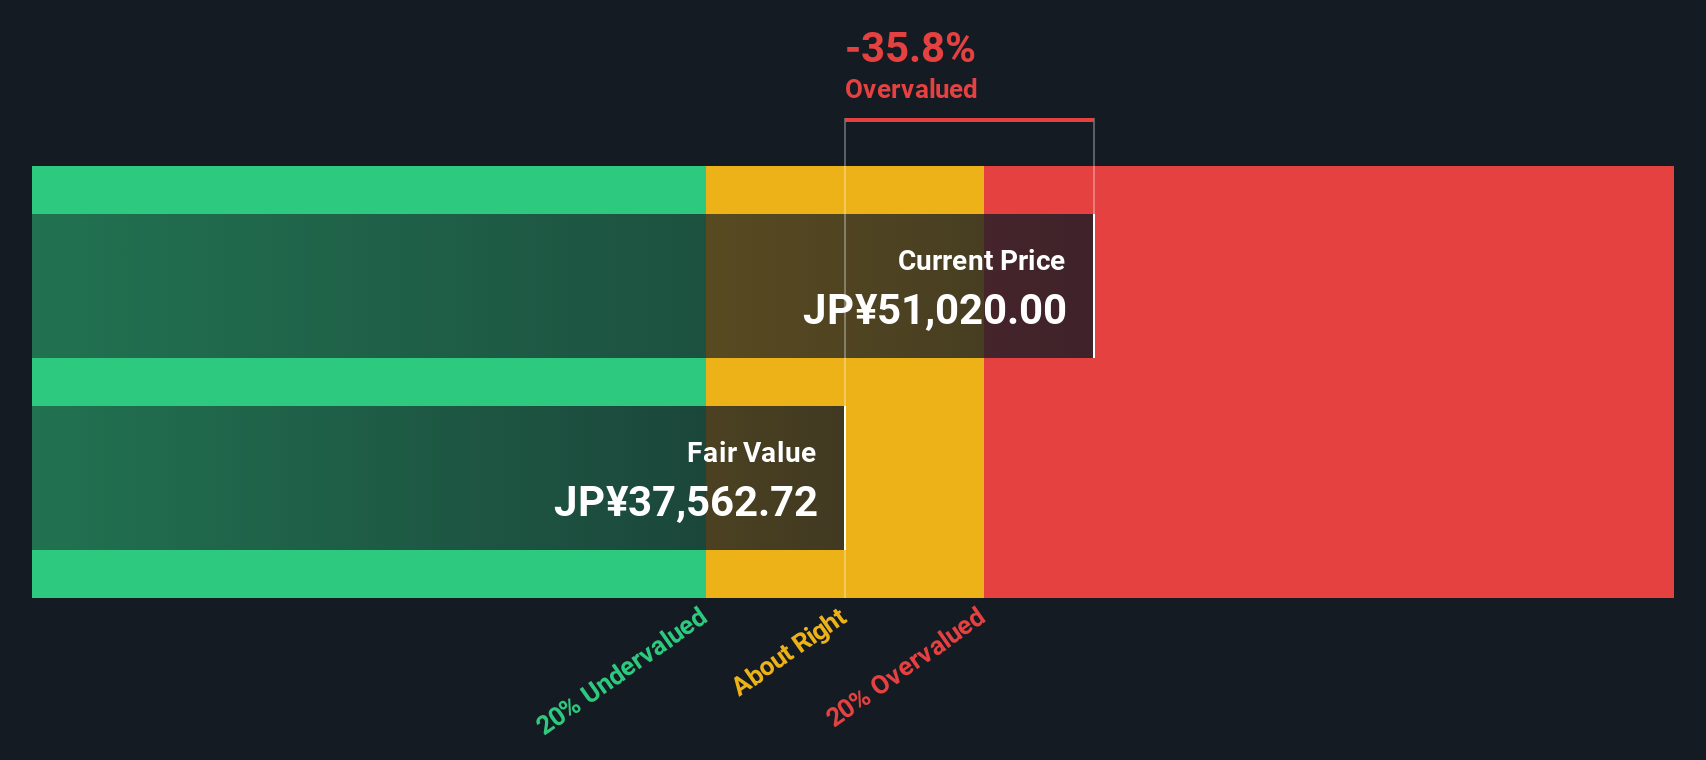
Approach 2: SMC Price vs Earnings
The Price-to-Earnings (PE) ratio is one of the most common ways to value a profitable business like SMC. For companies generating steady and reliable earnings, the PE ratio offers a quick sense of how much investors are willing to pay for each yen of profit. This can be a useful shorthand when making comparisons across an industry or market.
Not all PE ratios are created equal. Higher ratios typically signal that investors expect strong growth ahead, while lower ratios may point to slower growth or added risk. What feels “normal” for one company isn’t always the standard for another, so context is key.
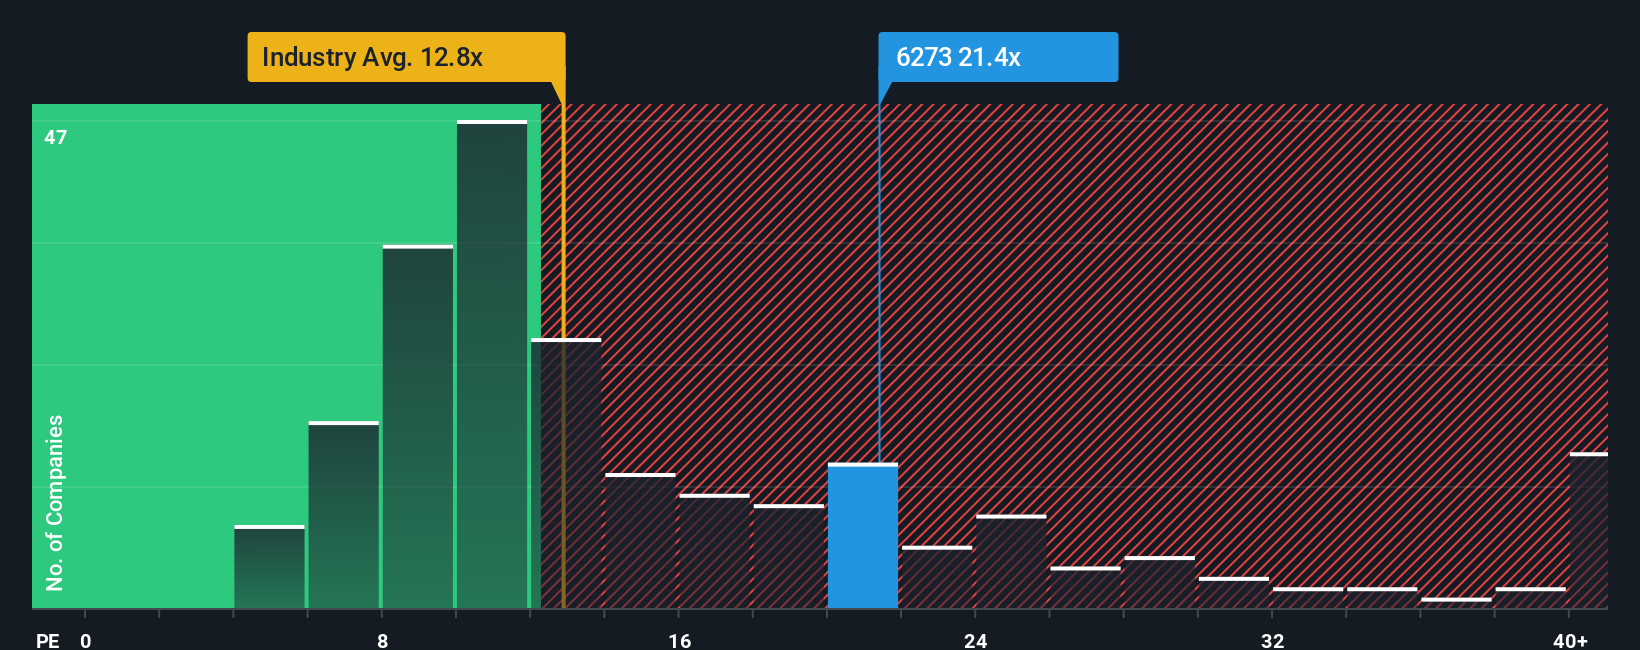
SMC is currently trading at a PE ratio of 19.8x, which sits well above the Machinery industry average of 13.6x but below the peer average of 22.1x. This is where the Simply Wall St “Fair Ratio” comes in, a tailored multiple of 21.5x in this analysis, which weighs SMC’s earnings outlook, profit margins, risk factors, scale, and its standing in the Machinery sector. The Fair Ratio provides a more nuanced benchmark than simply comparing to broad peer or industry figures, capturing the specific drivers relevant to SMC and its long-term prospects.
Given SMC’s PE of 19.8x compared to its Fair Ratio of 21.5x, the current price looks slightly conservative based on its fundamentals. SMC shares appear mildly undervalued using this approach, as the company trades below what would be expected for its profile.
Result: UNDERVALUED
Upgrade Your Decision Making: Choose your SMC Narrative
Earlier we mentioned that there is an even better way to understand valuation, so let's introduce you to Narratives. A Narrative is a simple but powerful concept: it is your personal story or perspective describing what you believe about a company, expressed through your assumptions about its fair value, future revenue, earnings, and margins. Narratives connect these beliefs to a financial forecast and ultimately to a calculated fair value, helping you see the link between your outlook and what you think the company is worth.
On Simply Wall St’s platform, Narratives are easy to create and use. Millions of investors share theirs under the Community page. Narratives make it effortless to decide when to buy or sell, letting you compare a company’s Fair Value, based on your estimates, to the market Price. As new information such as news or earnings is published, Narratives automatically update, keeping your view current and responsive.
For example, some investors believe SMC’s fair value is far below today's price, while others, using much more optimistic forecasts, see it as a bargain. Narratives put these perspectives side by side, so you can truly invest with confidence in your own story.
Do you think there's more to the story for SMC? Create your own Narrative to let the Community know!
This article by Simply Wall St is general in nature. We provide commentary based on historical data and analyst forecasts only using an unbiased methodology and our articles are not intended to be financial advice. It does not constitute a recommendation to buy or sell any stock, and does not take account of your objectives, or your financial situation. We aim to bring you long-term focused analysis driven by fundamental data. Note that our analysis may not factor in the latest price-sensitive company announcements or qualitative material. Simply Wall St has no position in any stocks mentioned.
New: Manage All Your Stock Portfolios in One Place
We've created the ultimate portfolio companion for stock investors, and it's free.
• Connect an unlimited number of Portfolios and see your total in one currency
• Be alerted to new Warning Signs or Risks via email or mobile
• Track the Fair Value of your stocks
Have feedback on this article? Concerned about the content? Get in touch with us directly. Alternatively, email editorial-team@simplywallst.com
About TSE:6273
Flawless balance sheet average dividend payer.
Similar Companies
Market Insights

Advertisement
Community Narratives
MINISO's fair value is projected at 26.69 with an anticipated PE ratio shift of 20x
Fair Value US$24.03|11.0% undervalued
BE
Community Contributor
Procter & Gamble: A Dividend Giant Facing Slowing Growth
Fair Value US$119.81|23.3% overvalued
AN
Community Contributor
Eli Lilly's Future Growth Driven by Tirzepatide and Favorable Market Conditions
Fair Value US$1.19k|13.8% undervalued
EA
Community Contributor