Stock Analysis
Shima Seiki Mfg.Ltd's (TSE:6222) earnings trajectory could turn positive as the stock pops 13% this past week


While it may not be enough for some shareholders, we think it is good to see the Shima Seiki Mfg.,Ltd. (TSE:6222) share price up 23% in a single quarter. But if you look at the last five years the returns have not been good. You would have done a lot better buying an index fund, since the stock has dropped 46% in that half decade.
While the last five years has been tough for Shima Seiki Mfg.Ltd shareholders, this past week has shown signs of promise. So let's look at the longer term fundamentals and see if they've been the driver of the negative returns.
See our latest analysis for Shima Seiki Mfg.Ltd
There is no denying that markets are sometimes efficient, but prices do not always reflect underlying business performance. One imperfect but simple way to consider how the market perception of a company has shifted is to compare the change in the earnings per share (EPS) with the share price movement.
Shima Seiki Mfg.Ltd became profitable within the last five years. That would generally be considered a positive, so we are surprised to see the share price is down. Other metrics may better explain the share price move.
We don't think that the 1.2% is big factor in the share price, since it's quite small, as dividends go. The revenue decline of 0.9% isn't too bad. But if the market expected durable top line growth, then that could explain the share price weakness.
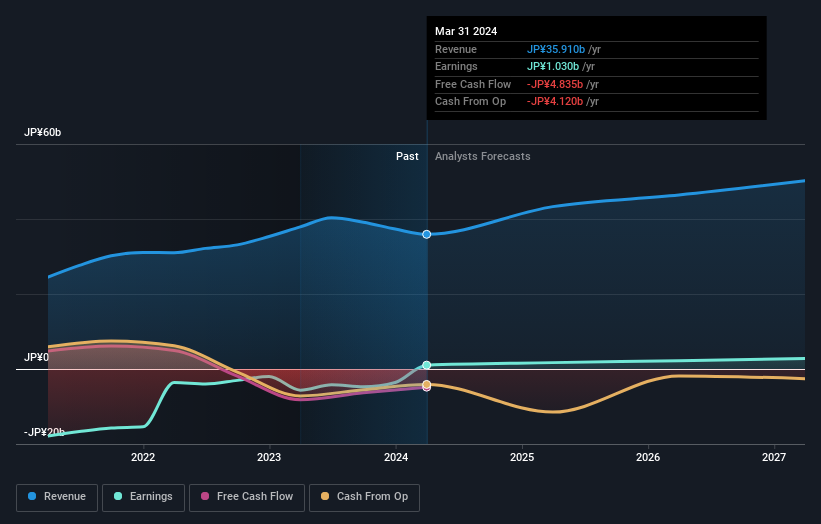
The company's revenue and earnings (over time) are depicted in the image below (click to see the exact numbers).
It is of course excellent to see how Shima Seiki Mfg.Ltd has grown profits over the years, but the future is more important for shareholders. If you are thinking of buying or selling Shima Seiki Mfg.Ltd stock, you should check out this FREE detailed report on its balance sheet.
What About Dividends?
It is important to consider the total shareholder return, as well as the share price return, for any given stock. The TSR is a return calculation that accounts for the value of cash dividends (assuming that any dividend received was reinvested) and the calculated value of any discounted capital raisings and spin-offs. It's fair to say that the TSR gives a more complete picture for stocks that pay a dividend. In the case of Shima Seiki Mfg.Ltd, it has a TSR of -43% for the last 5 years. That exceeds its share price return that we previously mentioned. The dividends paid by the company have thusly boosted the total shareholder return.
A Different Perspective
Investors in Shima Seiki Mfg.Ltd had a tough year, with a total loss of 9.9% (including dividends), against a market gain of about 19%. Even the share prices of good stocks drop sometimes, but we want to see improvements in the fundamental metrics of a business, before getting too interested. However, the loss over the last year isn't as bad as the 7% per annum loss investors have suffered over the last half decade. We'd need to see some sustained improvements in the key metrics before we could muster much enthusiasm. I find it very interesting to look at share price over the long term as a proxy for business performance. But to truly gain insight, we need to consider other information, too. Take risks, for example - Shima Seiki Mfg.Ltd has 1 warning sign we think you should be aware of.
For those who like to find winning investments this free list of undervalued companies with recent insider purchasing, could be just the ticket.
Please note, the market returns quoted in this article reflect the market weighted average returns of stocks that currently trade on Japanese exchanges.
Valuation is complex, but we're helping make it simple.
Find out whether Shima Seiki Mfg.Ltd is potentially over or undervalued by checking out our comprehensive analysis, which includes fair value estimates, risks and warnings, dividends, insider transactions and financial health.
View the Free AnalysisHave feedback on this article? Concerned about the content? Get in touch with us directly. Alternatively, email editorial-team (at) simplywallst.com.
This article by Simply Wall St is general in nature. We provide commentary based on historical data and analyst forecasts only using an unbiased methodology and our articles are not intended to be financial advice. It does not constitute a recommendation to buy or sell any stock, and does not take account of your objectives, or your financial situation. We aim to bring you long-term focused analysis driven by fundamental data. Note that our analysis may not factor in the latest price-sensitive company announcements or qualitative material. Simply Wall St has no position in any stocks mentioned.
Valuation is complex, but we're helping make it simple.
Find out whether Shima Seiki Mfg.Ltd is potentially over or undervalued by checking out our comprehensive analysis, which includes fair value estimates, risks and warnings, dividends, insider transactions and financial health.
View the Free AnalysisHave feedback on this article? Concerned about the content? Get in touch with us directly. Alternatively, email editorial-team@simplywallst.com
About TSE:6222
Shima Seiki Mfg.Ltd
Engages in the development, manufacture, sale, marketing, and service of computerized flat knitting machines, computerized flat knitting machines, automatic fabric cutting machines, design systems, and glove and sock knitting machines in Japan, Europe, the Middle East, Asia, the Americas, and internationally.
Excellent balance sheet with reasonable growth potential.
