Stock Analysis
Amada Co., Ltd. (TSE:6113) On An Uptrend: Could Fundamentals Be Driving The Stock?


Most readers would already know that Amada's (TSE:6113) stock increased by 7.2% over the past three months. Given that stock prices are usually aligned with a company's financial performance in the long-term, we decided to investigate if the company's decent financials had a hand to play in the recent price move. In this article, we decided to focus on Amada's ROE.
ROE or return on equity is a useful tool to assess how effectively a company can generate returns on the investment it received from its shareholders. In simpler terms, it measures the profitability of a company in relation to shareholder's equity.
View our latest analysis for Amada
How To Calculate Return On Equity?
Return on equity can be calculated by using the formula:
Return on Equity = Net Profit (from continuing operations) ÷ Shareholders' Equity
So, based on the above formula, the ROE for Amada is:
7.6% = JP¥41b ÷ JP¥534b (Based on the trailing twelve months to March 2024).
The 'return' is the yearly profit. That means that for every ¥1 worth of shareholders' equity, the company generated ¥0.08 in profit.
Why Is ROE Important For Earnings Growth?
So far, we've learned that ROE is a measure of a company's profitability. Depending on how much of these profits the company reinvests or "retains", and how effectively it does so, we are then able to assess a company’s earnings growth potential. Generally speaking, other things being equal, firms with a high return on equity and profit retention, have a higher growth rate than firms that don’t share these attributes.
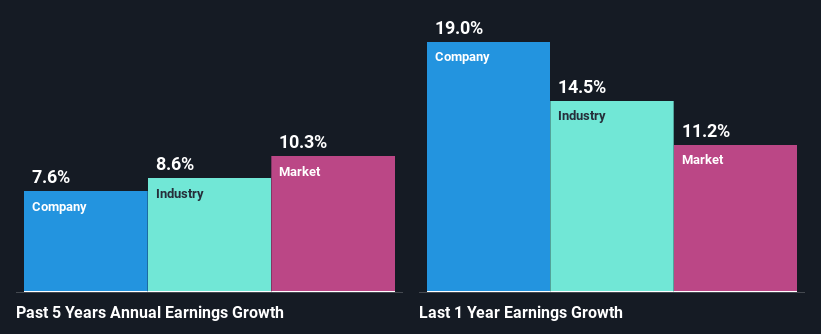
Amada's Earnings Growth And 7.6% ROE
At first glance, Amada's ROE doesn't look very promising. However, given that the company's ROE is similar to the average industry ROE of 7.4%, we may spare it some thought. Even so, Amada has shown a fairly decent growth in its net income which grew at a rate of 7.6%. Taking into consideration that the ROE is not particularly high, we reckon that there could also be other factors at play which could be influencing the company's growth. For instance, the company has a low payout ratio or is being managed efficiently.
Next, on comparing Amada's net income growth with the industry, we found that the company's reported growth is similar to the industry average growth rate of 8.6% over the last few years.
Earnings growth is an important metric to consider when valuing a stock. It’s important for an investor to know whether the market has priced in the company's expected earnings growth (or decline). Doing so will help them establish if the stock's future looks promising or ominous. What is 6113 worth today? The intrinsic value infographic in our free research report helps visualize whether 6113 is currently mispriced by the market.
Is Amada Efficiently Re-investing Its Profits?
Amada has a healthy combination of a moderate three-year median payout ratio of 47% (or a retention ratio of 53%) and a respectable amount of growth in earnings as we saw above, meaning that the company has been making efficient use of its profits.
Besides, Amada has been paying dividends for at least ten years or more. This shows that the company is committed to sharing profits with its shareholders.
Summary
On the whole, we do feel that Amada has some positive attributes. With a high rate of reinvestment, albeit at a low ROE, the company has managed to see a considerable growth in its earnings. That being so, a study of the latest analyst forecasts show that the company is expected to see a slowdown in its future earnings growth. To know more about the latest analysts predictions for the company, check out this visualization of analyst forecasts for the company.
Valuation is complex, but we're helping make it simple.
Find out whether Amada is potentially over or undervalued by checking out our comprehensive analysis, which includes fair value estimates, risks and warnings, dividends, insider transactions and financial health.
View the Free AnalysisHave feedback on this article? Concerned about the content? Get in touch with us directly. Alternatively, email editorial-team (at) simplywallst.com.
This article by Simply Wall St is general in nature. We provide commentary based on historical data and analyst forecasts only using an unbiased methodology and our articles are not intended to be financial advice. It does not constitute a recommendation to buy or sell any stock, and does not take account of your objectives, or your financial situation. We aim to bring you long-term focused analysis driven by fundamental data. Note that our analysis may not factor in the latest price-sensitive company announcements or qualitative material. Simply Wall St has no position in any stocks mentioned.
About TSE:6113
Amada
Manufactures, sells, leases, repairs, maintains, checks, and inspects metalworking machinery, software, and peripheral equipment in Japan, North America, Europe, Asia, and internationally.
Flawless balance sheet with solid track record and pays a dividend.
