- Japan
- /
- Electrical
- /
- TSE:5816
Onamba's (TSE:5816) five-year total shareholder returns outpace the underlying earnings growth


While Onamba Co., Ltd. (TSE:5816) shareholders are probably generally happy, the stock hasn't had particularly good run recently, with the share price falling 22% in the last quarter. But that doesn't change the fact that the returns over the last five years have been very strong. Indeed, the share price is up an impressive 177% in that time. Generally speaking the long term returns will give you a better idea of business quality than short periods can. The more important question is whether the stock is too cheap or too expensive today.
In light of the stock dropping 16% in the past week, we want to investigate the longer term story, and see if fundamentals have been the driver of the company's positive five-year return.
Check out our latest analysis for Onamba
To quote Buffett, 'Ships will sail around the world but the Flat Earth Society will flourish. There will continue to be wide discrepancies between price and value in the marketplace...' One flawed but reasonable way to assess how sentiment around a company has changed is to compare the earnings per share (EPS) with the share price.
Over half a decade, Onamba managed to grow its earnings per share at 22% a year. That makes the EPS growth particularly close to the yearly share price growth of 23%. That suggests that the market sentiment around the company hasn't changed much over that time. In fact, the share price seems to largely reflect the EPS growth.
You can see below how EPS has changed over time (discover the exact values by clicking on the image).
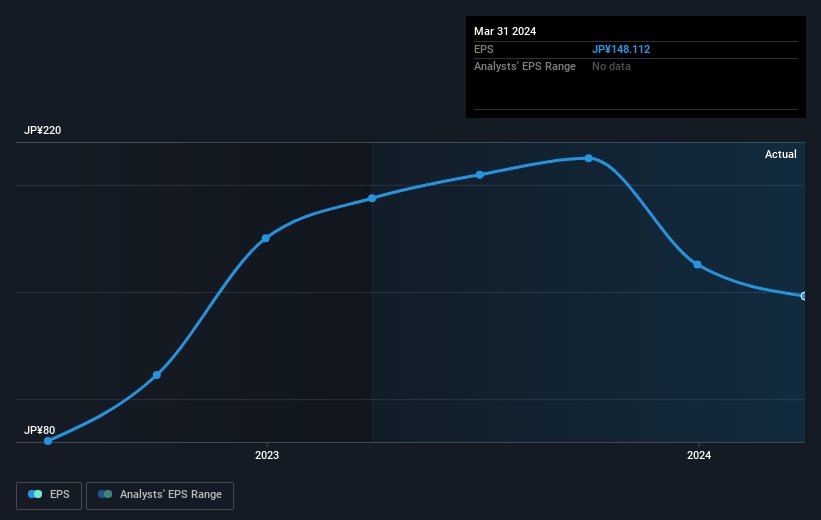
Before buying or selling a stock, we always recommend a close examination of historic growth trends, available here.
What About Dividends?
When looking at investment returns, it is important to consider the difference between total shareholder return (TSR) and share price return. The TSR is a return calculation that accounts for the value of cash dividends (assuming that any dividend received was reinvested) and the calculated value of any discounted capital raisings and spin-offs. It's fair to say that the TSR gives a more complete picture for stocks that pay a dividend. As it happens, Onamba's TSR for the last 5 years was 233%, which exceeds the share price return mentioned earlier. And there's no prize for guessing that the dividend payments largely explain the divergence!
A Different Perspective
It's good to see that Onamba has rewarded shareholders with a total shareholder return of 16% in the last twelve months. And that does include the dividend. Having said that, the five-year TSR of 27% a year, is even better. The pessimistic view would be that be that the stock has its best days behind it, but on the other hand the price might simply be moderating while the business itself continues to execute. While it is well worth considering the different impacts that market conditions can have on the share price, there are other factors that are even more important. Take risks, for example - Onamba has 2 warning signs we think you should be aware of.
We will like Onamba better if we see some big insider buys. While we wait, check out this free list of undervalued stocks (mostly small caps) with considerable, recent, insider buying.
Please note, the market returns quoted in this article reflect the market weighted average returns of stocks that currently trade on Japanese exchanges.
New: AI Stock Screener & Alerts
Our new AI Stock Screener scans the market every day to uncover opportunities.
• Dividend Powerhouses (3%+ Yield)
• Undervalued Small Caps with Insider Buying
• High growth Tech and AI Companies
Or build your own from over 50 metrics.
Have feedback on this article? Concerned about the content? Get in touch with us directly. Alternatively, email editorial-team (at) simplywallst.com.
This article by Simply Wall St is general in nature. We provide commentary based on historical data and analyst forecasts only using an unbiased methodology and our articles are not intended to be financial advice. It does not constitute a recommendation to buy or sell any stock, and does not take account of your objectives, or your financial situation. We aim to bring you long-term focused analysis driven by fundamental data. Note that our analysis may not factor in the latest price-sensitive company announcements or qualitative material. Simply Wall St has no position in any stocks mentioned.
Have feedback on this article? Concerned about the content? Get in touch with us directly. Alternatively, email editorial-team@simplywallst.com
About TSE:5816
Onamba
Manufactures and distributes wires and components for household electronic appliances, business equipment, and industrial electronic appliances in Japan and internationally.
Flawless balance sheet average dividend payer.
