SWCC (TSE:5805) has just seen a fresh swing in its stock, and it is easy to see why investors are tuning in. When a stock catches a tailwind like this, especially without any big headline driving the move, it often leaves investors wondering if they are witnessing the start of a trend or simply a passing blip. Today’s action has naturally sparked a conversation: is there more to the story beneath the recent price uptick?
Over the past year, SWCC’s performance has been hard to ignore. The stock has surged 74% in the last twelve months and continues to trend strong with an impressive 31% jump in the past 3 months. Compared to other capital goods names, that sort of sustained momentum stands out, even as annual revenue is climbing at about 4% and net income is up nearly 12%. While there have not been any major news flashes in recent weeks, recent price gains seem to signal shifting sentiment or recalibrating risk.
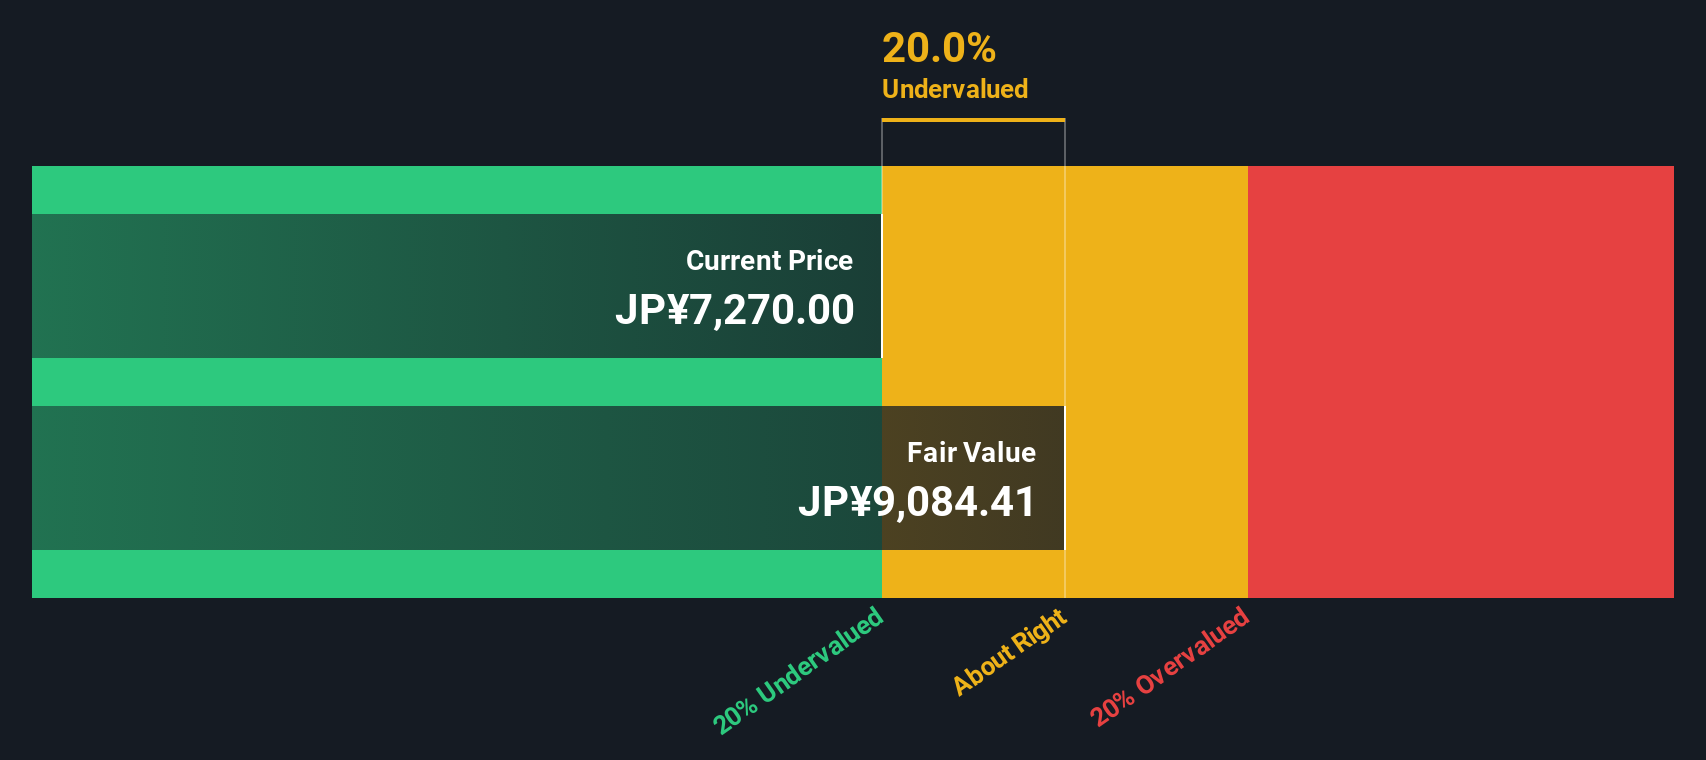
Given these returns, it is fair to ask: is SWCC still trading at a discount and ripe for further gains, or are investors already pricing in all the future growth?
Advertisement
Price-to-Earnings of 22.5x: Is it justified?
At a Price-to-Earnings (P/E) ratio of 22.5x, SWCC is trading above the average for the Japanese electrical industry. This ratio suggests the market is currently willing to pay a premium for each yen of SWCC's earnings compared to sector peers.
The P/E ratio measures how much investors are paying for a company's earnings, reflecting expectations of future growth and profitability. In capital goods and electrical sectors, it is often used to benchmark relative value, since earnings can be a key driver of share prices.
SWCC's elevated P/E means the stock is priced higher than many industry competitors, despite its solid revenue and profit growth. While the market may be factoring in ongoing improvements in earnings, the question remains whether enough upside justifies this richer valuation compared to sector norms.
Taking a different approach, the SWS DCF model paints a similar picture. This suggests SWCC remains undervalued even after the recent run-up. Could both methods be right, or is the reality somewhere in between?
If our analysis does not quite match your own perspective, or you trust your own research process, you can put together your own take in just a few minutes. Do it your way
Expand your portfolio beyond SWCC by taking advantage of powerful tools that spotlight stocks with strong growth potential, healthy returns, and future-proof tech. Act now so you do not miss out on the next big trend.
Accelerate your search for tomorrow's leaders by uncovering established companies offering dividend stocks with yields above 3% through dividend stocks with yields > 3%.
Turn cutting-edge innovation into growth by scouting out AI-driven companies breaking new ground in AI penny stocks.
Cement your edge in the market by identifying stocks trading below their true value based on cash flow strength using undervalued stocks based on cash flows.
This article by Simply Wall St is general in nature. We provide commentary based on historical data
and analyst forecasts only using an unbiased methodology and our articles are not intended to be financial advice. It does not constitute a recommendation to buy or sell any stock, and does not take account of your objectives, or your
financial situation. We aim to bring you long-term focused analysis driven by fundamental data.
Note that our analysis may not factor in the latest price-sensitive company announcements or qualitative material.
Simply Wall St has no position in any stocks mentioned.
New: Manage All Your Stock Portfolios in One Place
We've created the ultimate portfolio companion for stock investors, and it's free.
• Connect an unlimited number of Portfolios and see your total in one currency • Be alerted to new Warning Signs or Risks via email or mobile • Track the Fair Value of your stocks