Advertisement
- Japan
- /
- Electrical
- /
- TSE:5803
Fujikura (TSE:5803) Valuation in Focus as Board Considers Forecast and Dividend Updates

Simply Wall St
Reviewed by Simply Wall St
Fujikura (TSE:5803) has drawn investor attention ahead of its November 7 board meeting, where the board is set to discuss key decisions on updating consolidated financial forecasts and reviewing year-end dividends.
See our latest analysis for Fujikura.
Fujikura’s share price has soared an extraordinary 211% so far this year, driven by strong market momentum and anticipation around key board decisions. After reaching an all-time high on news of a possible forecast revision and dividend review, the company now posts a remarkable 1-year total shareholder return of nearly 277%, with multi-year growth that outpaces most industrial peers.
If you’re curious about what other fast-moving companies with standout momentum and strong insider conviction are out there, now is the perfect time to discover fast growing stocks with high insider ownership
But with Fujikura's rapid ascent, the key question now is whether the current share price reflects all the company’s future growth, or if there is still untapped value for prospective investors to uncover.
Price-to-Earnings of 54.9x: Is it justified?
Fujikura shares currently trade at a price-to-earnings (P/E) ratio of 54.9x, meaning the market price implies very high expectations for the company’s future earnings compared to both its peers and the sector average.
The price-to-earnings ratio measures how much investors are willing to pay for each unit of net profit. For Fujikura, this premium multiple highlights strong market enthusiasm, but also raises the question of whether current earnings growth justifies such a lofty price.
Compared to the Japanese Electrical industry average of 13.2x and the peer average of 17.9x, Fujikura’s P/E stands out as significantly higher. The gap between its current multiple and the estimated fair P/E ratio of 42.6x suggests room for a potential correction if growth expectations are not met, or scope for the market to move towards the fair value if the narrative holds.
Explore the SWS fair ratio for Fujikura
Result: Price-to-Earnings of 54.9x (OVERVALUED)
However, unexpected shifts in earnings growth or a sharp correction toward analyst price targets could quickly challenge the optimism that has been fueling Fujikura’s recent rally.
Find out about the key risks to this Fujikura narrative.
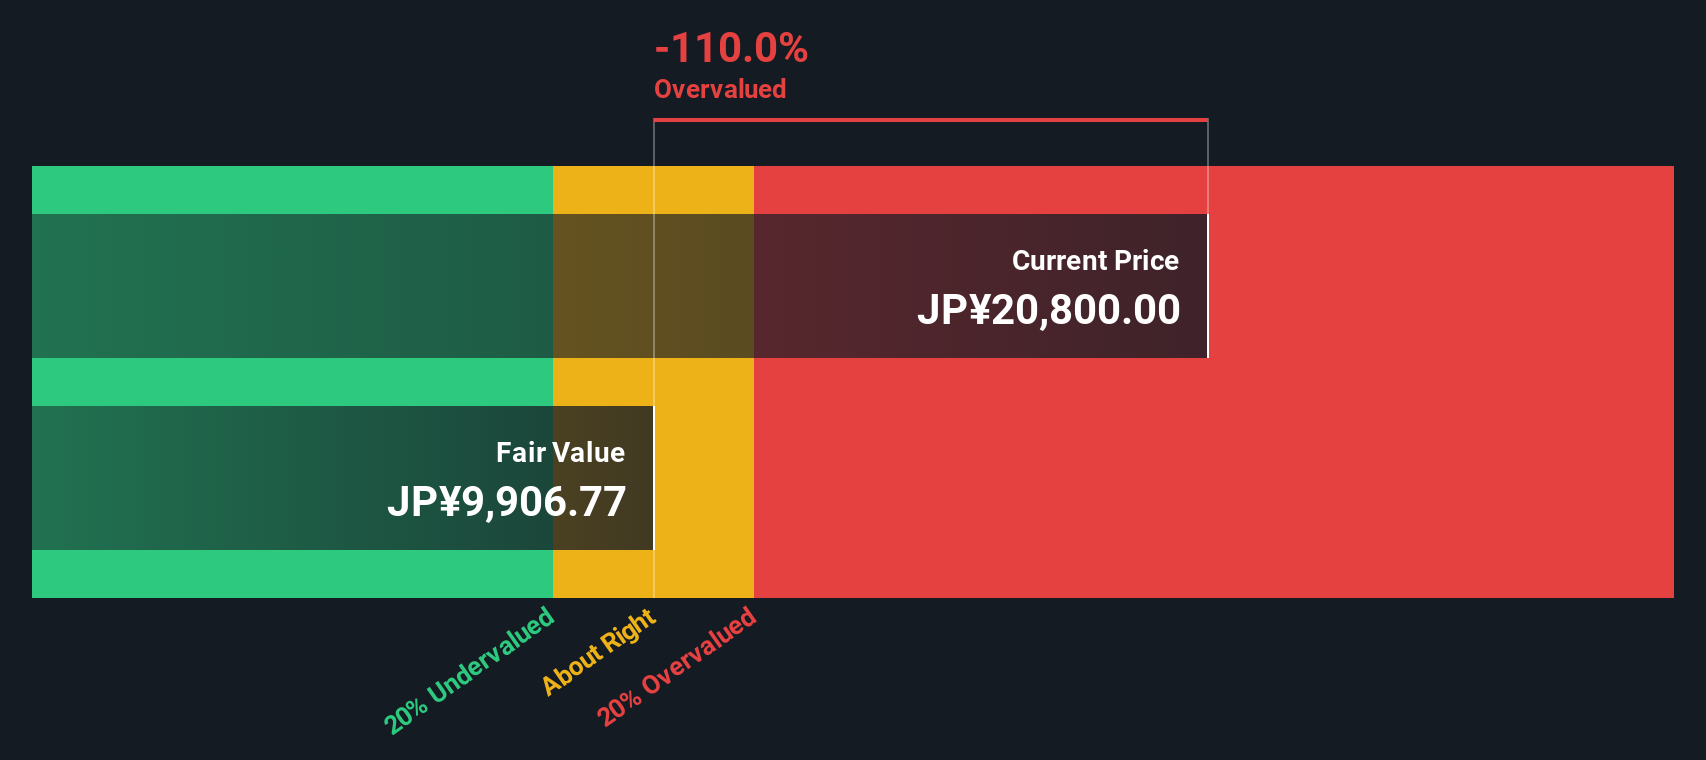
Another View: Discounted Cash Flow Tells a Different Story
Looking at Fujikura through the lens of our DCF model brings a very different perspective. The SWS DCF model suggests that Fujikura is currently trading well above its estimated fair value, which may mean the market price has moved ahead of fundamentals. Could this signal added risk or a heightened expectation for future performance?
Look into how the SWS DCF model arrives at its fair value.
Simply Wall St performs a discounted cash flow (DCF) on every stock in the world every day (check out Fujikura for example). We show the entire calculation in full. You can track the result in your watchlist or portfolio and be alerted when this changes, or use our stock screener to discover 861 undervalued stocks based on their cash flows. If you save a screener we even alert you when new companies match - so you never miss a potential opportunity.
Build Your Own Fujikura Narrative
If you see the story differently or want to dig into the numbers on your own terms, you can quickly craft your personal take in just minutes with Do it your way
A great starting point for your Fujikura research is our analysis highlighting 2 key rewards and 1 important warning sign that could impact your investment decision.
Looking for More Stock Opportunities?
Don’t let future winners pass you by. Open the door to even more smart investment angles with the powerful Simply Wall Street screener tools below.
- Capture value by targeting these 861 undervalued stocks based on cash flows, which show strong fundamentals but remain overlooked by the broader market.
- Boost your passive income by selecting these 17 dividend stocks with yields > 3%, with yields above 3% and a record of stable payouts.
- Ride the wave of innovation and gain exposure to AI advancements through these 25 AI penny stocks, shaping tomorrow’s industries.
This article by Simply Wall St is general in nature. We provide commentary based on historical data and analyst forecasts only using an unbiased methodology and our articles are not intended to be financial advice. It does not constitute a recommendation to buy or sell any stock, and does not take account of your objectives, or your financial situation. We aim to bring you long-term focused analysis driven by fundamental data. Note that our analysis may not factor in the latest price-sensitive company announcements or qualitative material. Simply Wall St has no position in any stocks mentioned.
New: AI Stock Screener & Alerts
Our new AI Stock Screener scans the market every day to uncover opportunities.
• Dividend Powerhouses (3%+ Yield)
• Undervalued Small Caps with Insider Buying
• High growth Tech and AI Companies
Or build your own from over 50 metrics.
Have feedback on this article? Concerned about the content? Get in touch with us directly. Alternatively, email editorial-team@simplywallst.com
About TSE:5803
Fujikura
Engages in telecommunication and power systems, electronic, and automotive products businesses in Japan, the rest of Asia, North America, Europe, and internationally.
Outstanding track record with flawless balance sheet.
Similar Companies
Market Insights

Advertisement
Community Narratives
The company that turned a verb into a global necessity and basically runs the modern internet, digital ads, smartphones, maps, and AI.
Fair Value US$300.00|5.1% undervalued
OS
Community Contributor
Flowers Foods Pays A Fair Price For Health
Fair Value US$16.12|27.7% undervalued
NV
Community Contributor
TMX Group will thrive with 33.3% profit margin and enduring market moat
Fair Value CA$49.90|0.2% overvalued
LI
Community Contributor
The "Molecular Pencil": Why Beam's Technology is Built to Win
Fair Value US$65.01|64.4% undervalued
DA
Community Contributor