
Advertisement
- Japan
- /
- Construction
- /
- TSE:1960
Investors Still Aren't Entirely Convinced By Sanyo Engineering & Construction Inc.'s (TSE:1960) Revenues Despite 34% Price Jump
Sanyo Engineering & Construction Inc. (TSE:1960) shares have continued their recent momentum with a 34% gain in the last month alone. Looking back a bit further, it's encouraging to see the stock is up 86% in the last year.
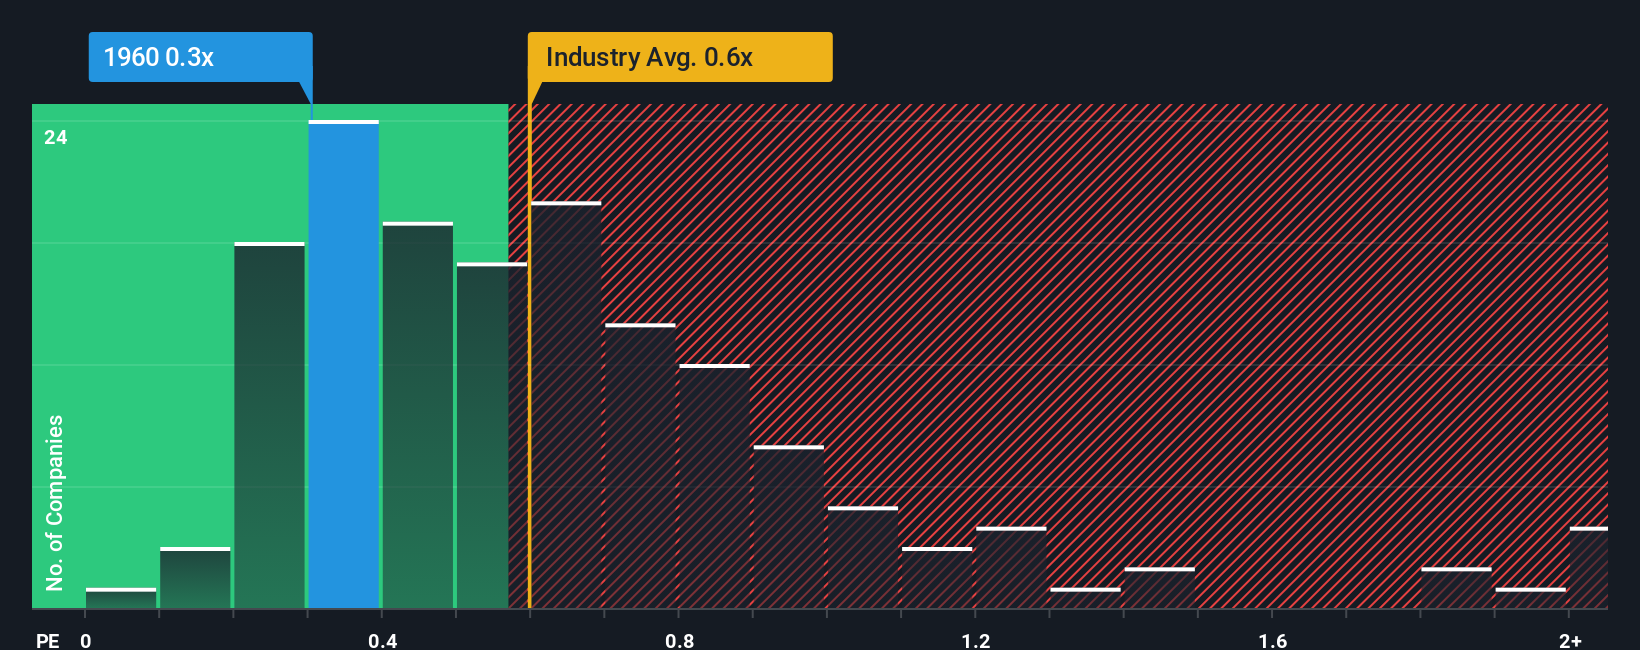
In spite of the firm bounce in price, it's still not a stretch to say that Sanyo Engineering & Construction's price-to-sales (or "P/S") ratio of 0.3x right now seems quite "middle-of-the-road" compared to the Construction industry in Japan, where the median P/S ratio is around 0.6x. While this might not raise any eyebrows, if the P/S ratio is not justified investors could be missing out on a potential opportunity or ignoring looming disappointment.
Check out our latest analysis for Sanyo Engineering & Construction
What Does Sanyo Engineering & Construction's P/S Mean For Shareholders?
Sanyo Engineering & Construction has been doing a good job lately as it's been growing revenue at a solid pace. It might be that many expect the respectable revenue performance to wane, which has kept the P/S from rising. If you like the company, you'd be hoping this isn't the case so that you could potentially pick up some stock while it's not quite in favour.
Want the full picture on earnings, revenue and cash flow for the company? Then our free report on Sanyo Engineering & Construction will help you shine a light on its historical performance.Do Revenue Forecasts Match The P/S Ratio?
There's an inherent assumption that a company should be matching the industry for P/S ratios like Sanyo Engineering & Construction's to be considered reasonable.
If we review the last year of revenue growth, the company posted a terrific increase of 28%. The latest three year period has also seen an excellent 74% overall rise in revenue, aided by its short-term performance. Accordingly, shareholders would have definitely welcomed those medium-term rates of revenue growth.
Comparing that recent medium-term revenue trajectory with the industry's one-year growth forecast of 1.9% shows it's noticeably more attractive.
In light of this, it's curious that Sanyo Engineering & Construction's P/S sits in line with the majority of other companies. It may be that most investors are not convinced the company can maintain its recent growth rates.
What We Can Learn From Sanyo Engineering & Construction's P/S?
Its shares have lifted substantially and now Sanyo Engineering & Construction's P/S is back within range of the industry median. While the price-to-sales ratio shouldn't be the defining factor in whether you buy a stock or not, it's quite a capable barometer of revenue expectations.
We didn't quite envision Sanyo Engineering & Construction's P/S sitting in line with the wider industry, considering the revenue growth over the last three-year is higher than the current industry outlook. When we see strong revenue with faster-than-industry growth, we can only assume potential risks are what might be placing pressure on the P/S ratio. At least the risk of a price drop looks to be subdued if recent medium-term revenue trends continue, but investors seem to think future revenue could see some volatility.
There are also other vital risk factors to consider and we've discovered 2 warning signs for Sanyo Engineering & Construction (1 is concerning!) that you should be aware of before investing here.
If these risks are making you reconsider your opinion on Sanyo Engineering & Construction, explore our interactive list of high quality stocks to get an idea of what else is out there.
New: Manage All Your Stock Portfolios in One Place
We've created the ultimate portfolio companion for stock investors, and it's free.
• Connect an unlimited number of Portfolios and see your total in one currency
• Be alerted to new Warning Signs or Risks via email or mobile
• Track the Fair Value of your stocks
Have feedback on this article? Concerned about the content? Get in touch with us directly. Alternatively, email editorial-team (at) simplywallst.com.
This article by Simply Wall St is general in nature. We provide commentary based on historical data and analyst forecasts only using an unbiased methodology and our articles are not intended to be financial advice. It does not constitute a recommendation to buy or sell any stock, and does not take account of your objectives, or your financial situation. We aim to bring you long-term focused analysis driven by fundamental data. Note that our analysis may not factor in the latest price-sensitive company announcements or qualitative material. Simply Wall St has no position in any stocks mentioned.
About TSE:1960
Sanyo Engineering & Construction
Engages in the electric facility construction business in Japan and internationally.
Solid track record with adequate balance sheet.
Market Insights

Advertisement
Community Narratives
The company that turned a verb into a global necessity and basically runs the modern internet, digital ads, smartphones, maps, and AI.
Fair Value US$300.00|10.2% undervalued
OS
Community Contributor
Flowers Foods Pays A Fair Price For Health
Fair Value US$16.12|20.3% undervalued
NV
Community Contributor
TMX Group will thrive with 33.3% profit margin and enduring market moat
Fair Value CA$49.90|0.1% undervalued
LI
Community Contributor