Advertisement
- Japan
- /
- Construction
- /
- TSE:1414
SHO-BOND Holdings (TSE:1414): Valuation in Focus After Earnings Guidance and Stock Split Announcement

Simply Wall St
Reviewed by Simply Wall St
SHO-BOND HoldingsLtd (TSE:1414) just shared fresh earnings guidance for the fiscal year ending June 2026, along with plans to amend its Articles of Incorporation in connection with an upcoming stock split. Both updates are drawing close investor attention.
See our latest analysis for SHO-BOND HoldingsLtd.
Momentum has been somewhat muted for SHO-BOND HoldingsLtd, with the latest company updates drawing investor focus but not yet reversing a longer-term downtrend. While the share price recently climbed 3.2% over the past month, the one-year total shareholder return sits at -1.3%, and the stock remains down over three years, which suggests the market is weighing its growth potential against persistent headwinds.
If recent announcements have you watching the market with renewed interest, consider broadening your horizon and discover fast growing stocks with high insider ownership.
With fresh guidance and structural changes on the table, investors are left to consider whether SHO-BOND HoldingsLtd is truly undervalued at current levels or if the market has already factored in its future prospects. Does this create a buying opportunity, or is everything already priced in?
Price-to-Earnings of 16.9x: Is it justified?
SHO-BOND HoldingsLtd currently trades at a price-to-earnings (P/E) ratio of 16.9x, placing it well above both its immediate industry competitors and broader fair value estimates. At the last close price of ¥4,976, the company's valuation looks stretched alongside its muted stock performance.
The price-to-earnings ratio captures how much investors are willing to pay today for each yen of earnings generated by the company. For the construction sector, this is a vital benchmark, reflecting market expectations for profit growth, stability, and risk relative to peers.
Despite solid historical profit growth, SHO-BOND HoldingsLtd is being valued more richly than the JP Construction industry average (11.8x), the peer average (12.8x), and our fair P/E benchmark (12.2x). Across every comparison, the current P/E signals investors may be pricing in higher expectations than what trends and forecasts support. If the market starts refocusing on fundamentals, valuations may gradually move closer to the fair ratio level.
Explore the SWS fair ratio for SHO-BOND HoldingsLtd
Result: Price-to-Earnings of 16.9x (OVERVALUED)
However, revenue and net income growth remain moderate. Any slowdown or negative revisions could challenge the current valuation story.
Find out about the key risks to this SHO-BOND HoldingsLtd narrative.
Another View: Discounted Cash Flow Tells a Different Story
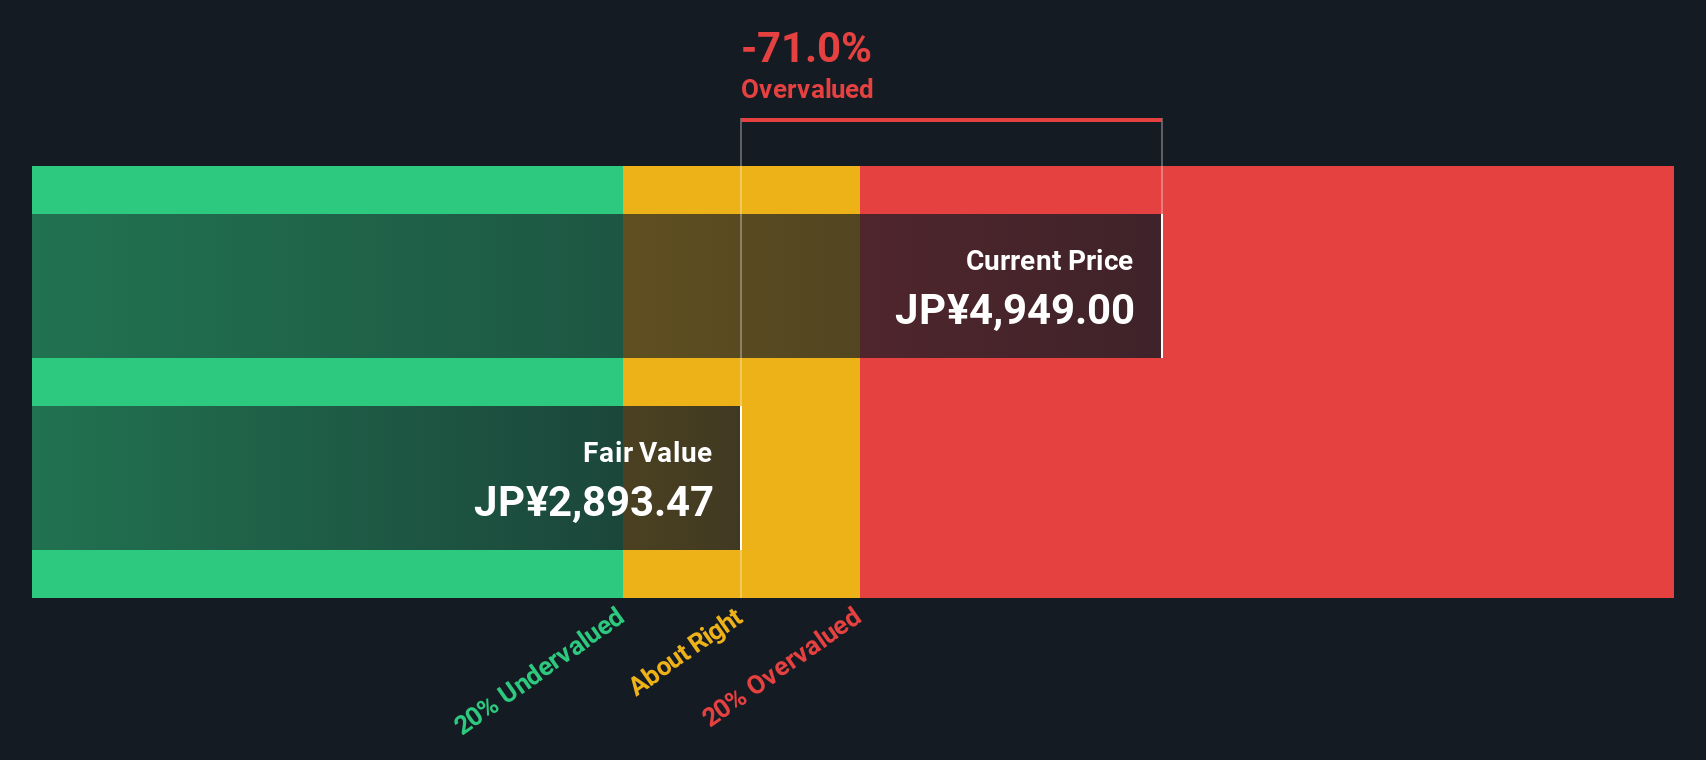
Looking through the lens of our SWS DCF model, SHO-BOND HoldingsLtd appears significantly overvalued, trading at ¥4,976 against an intrinsic value estimate closer to ¥2,896.24. This suggests that, despite robust earnings and a premium P/E ratio, the current market price could be outpacing the company’s true cash flow potential.
Look into how the SWS DCF model arrives at its fair value.
Simply Wall St performs a discounted cash flow (DCF) on every stock in the world every day (check out SHO-BOND HoldingsLtd for example). We show the entire calculation in full. You can track the result in your watchlist or portfolio and be alerted when this changes, or use our stock screener to discover 899 undervalued stocks based on their cash flows. If you save a screener we even alert you when new companies match - so you never miss a potential opportunity.
Build Your Own SHO-BOND HoldingsLtd Narrative
If you have a different perspective or want to dig deeper into the numbers, you can easily craft your own story in just a few minutes. Do it your way.
A great starting point for your SHO-BOND HoldingsLtd research is our analysis highlighting 2 key rewards and 1 important warning sign that could impact your investment decision.
Looking for More Opportunities?
Move beyond the obvious and find winning stocks using powerful tools you can trust. Take charge of your research, and don't let these opportunities slip away.
- Tap into growth potential by targeting these 899 undervalued stocks based on cash flows that are priced below their intrinsic value. This can give you an edge over the crowd.
- Boost your income strategy and secure steady cash flow with these 18 dividend stocks with yields > 3% offering attractive yields above 3%.
- Ride the next tech wave by backing innovators in artificial intelligence through these 26 AI penny stocks, where leading-edge technology meets high growth.
This article by Simply Wall St is general in nature. We provide commentary based on historical data and analyst forecasts only using an unbiased methodology and our articles are not intended to be financial advice. It does not constitute a recommendation to buy or sell any stock, and does not take account of your objectives, or your financial situation. We aim to bring you long-term focused analysis driven by fundamental data. Note that our analysis may not factor in the latest price-sensitive company announcements or qualitative material. Simply Wall St has no position in any stocks mentioned.
New: Manage All Your Stock Portfolios in One Place
We've created the ultimate portfolio companion for stock investors, and it's free.
• Connect an unlimited number of Portfolios and see your total in one currency
• Be alerted to new Warning Signs or Risks via email or mobile
• Track the Fair Value of your stocks
Have feedback on this article? Concerned about the content? Get in touch with us directly. Alternatively, email editorial-team@simplywallst.com
About TSE:1414
SHO-BOND HoldingsLtd
Engages in repairing and reinforcing social infrastructures in Japan.
Flawless balance sheet average dividend payer.
Market Insights

Advertisement
Community Narratives
MINISO's fair value is projected at 26.69 with an anticipated PE ratio shift of 20x
Fair Value US$24.03|12.0% undervalued
BE
Community Contributor
Procter & Gamble: A Dividend Giant Facing Slowing Growth
Fair Value US$119.81|21.7% overvalued
AN
Community Contributor
Eli Lilly's Future Growth Driven by Tirzepatide and Favorable Market Conditions
Fair Value US$1.19k|14.1% undervalued
EA
Community Contributor