Advertisement
San-in Godo Bank (TSE:8381): Valuation Insights After Strong Earnings Growth and New Share Buyback Plan

Simply Wall St
Reviewed by Simply Wall St
San-in Godo BankLtd (TSE:8381) has drawn attention with impressive half-year earnings growth and a newly announced plan to buy back up to one million shares. This highlights management’s focus on shareholder returns and operational momentum.
See our latest analysis for San-in Godo BankLtd.
The upbeat figures and share buyback news have sharpened investor focus on San-in Godo Bank Ltd, propelling a 9.6% year-to-date share price return. The real highlight is the three-year total shareholder return of 125%, showing strong momentum and renewed confidence in the bank’s outlook.
If the combination of financial strength and shareholder-focused moves has you curious, it could be the perfect time to explore fast growing stocks with high insider ownership.
With such strong earnings updates and a new share buyback plan, the question now is whether San-in Godo BankLtd still trades at a bargain, or if the stock’s impressive run means future growth is fully reflected. Could this be a new buying opportunity, or is the market already a step ahead?
Price-to-Earnings of 12.2x: Is it Justified?
San-in Godo BankLtd currently trades at a price-to-earnings ratio of 12.2x, meaning investors are paying more for each unit of earnings compared to many Japanese banks. At the last close of ¥1,393, the figure suggests the stock is actually a bit more expensive than some direct competitors.
The price-to-earnings (P/E) ratio measures a company's current share price relative to its per-share earnings. In the banking sector, P/E is a popular tool for assessing whether a stock is overvalued or undervalued by comparing profitability expectations throughout the industry.
While San-in Godo BankLtd's P/E of 12.2x is attractive compared to the peer average of 14.8x, it is higher than the JP Banks industry average of 11.2x. This may signal that some investors see superior quality or growth ahead, but it also means sentiment is not as bullish as for the broader banking sector, and the premium is not extreme. As no fair ratio estimate is available, the level may remain close to industry averages unless expectations shift significantly.
See what the numbers say about this price — find out in our valuation breakdown.
Result: Price-to-Earnings of 12.2x (ABOUT RIGHT)
However, risks remain, such as changes in economic conditions or sector volatility. These factors could quickly shift market sentiment and impact future returns.
Find out about the key risks to this San-in Godo BankLtd narrative.
Another View: What Does the DCF Model Reveal?
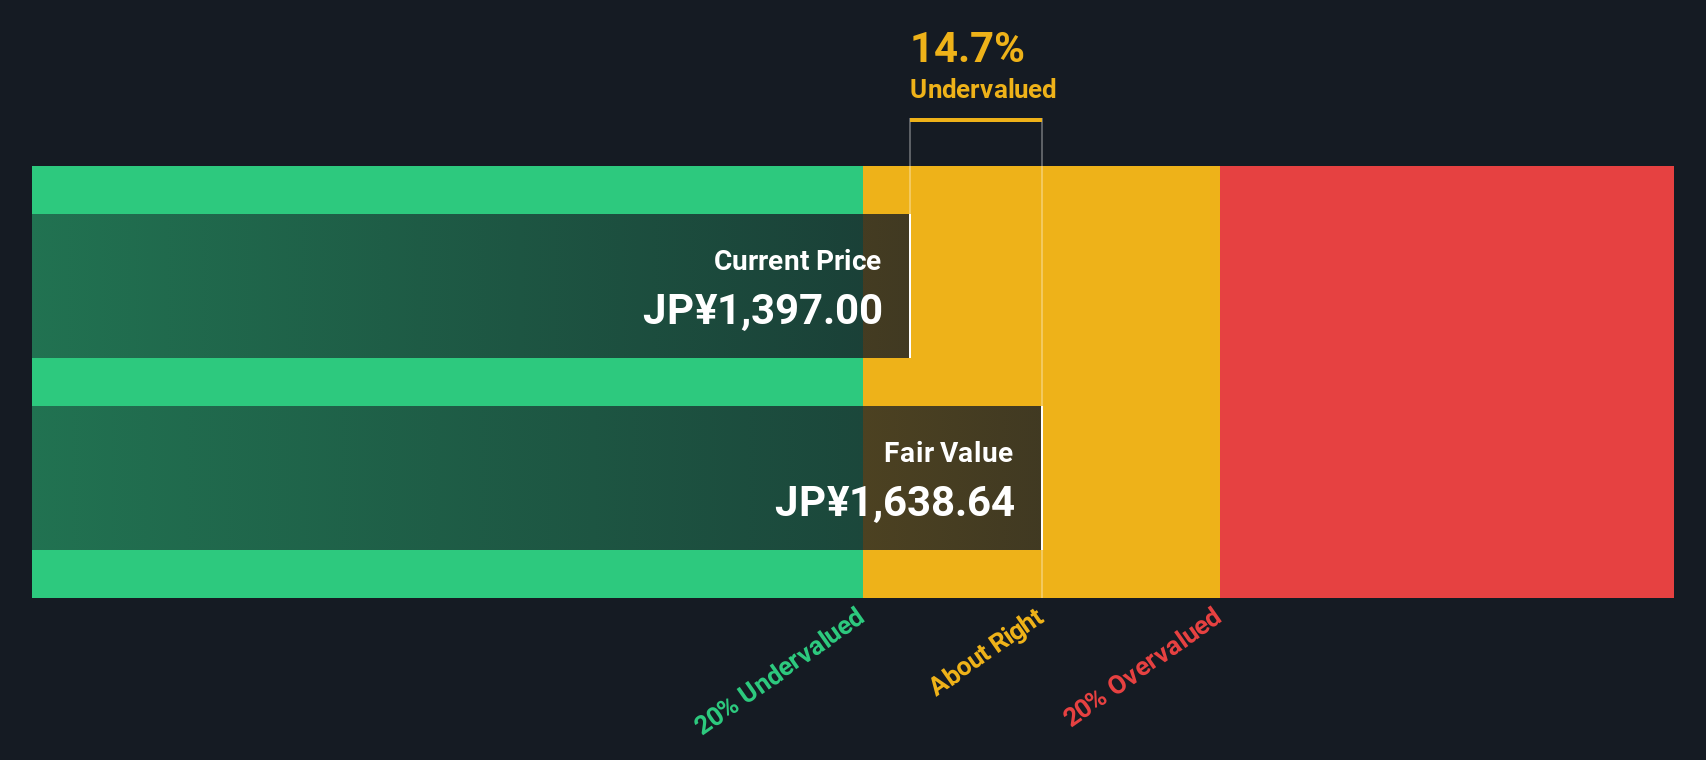
Looking beyond price-to-earnings, our SWS DCF model takes cash flows into account and currently values San-in Godo Bank Ltd at about ¥1,639 per share. This suggests the stock trades at roughly 15% below its fair value. Could the market be underestimating its long-term potential?
Look into how the SWS DCF model arrives at its fair value.
Simply Wall St performs a discounted cash flow (DCF) on every stock in the world every day (check out San-in Godo BankLtd for example). We show the entire calculation in full. You can track the result in your watchlist or portfolio and be alerted when this changes, or use our stock screener to discover 881 undervalued stocks based on their cash flows. If you save a screener we even alert you when new companies match - so you never miss a potential opportunity.
Build Your Own San-in Godo BankLtd Narrative
If you would rather dig into the numbers yourself or have a different perspective on the story, you can create your own analysis in just a few minutes with our tools. So why not Do it your way.
A great starting point for your San-in Godo BankLtd research is our analysis highlighting 1 key reward and 2 important warning signs that could impact your investment decision.
Looking for More Smart Investment Ideas?
Don't let your search stop here. The most exciting trends and growth opportunities could be just a click away with our powerful screener tools.
- Tap into future-defining sectors by searching through these 27 quantum computing stocks for companies making strides in quantum computing and next-level innovation.
- Maximize your yield by reviewing these 14 dividend stocks with yields > 3%, featuring stocks with robust dividend payouts that can enhance your portfolio’s income potential.
- Uncover hidden potential among these 27 AI penny stocks on the frontline of artificial intelligence, shaping tomorrow’s digital landscape today.
This article by Simply Wall St is general in nature. We provide commentary based on historical data and analyst forecasts only using an unbiased methodology and our articles are not intended to be financial advice. It does not constitute a recommendation to buy or sell any stock, and does not take account of your objectives, or your financial situation. We aim to bring you long-term focused analysis driven by fundamental data. Note that our analysis may not factor in the latest price-sensitive company announcements or qualitative material. Simply Wall St has no position in any stocks mentioned.
New: Manage All Your Stock Portfolios in One Place
We've created the ultimate portfolio companion for stock investors, and it's free.
• Connect an unlimited number of Portfolios and see your total in one currency
• Be alerted to new Warning Signs or Risks via email or mobile
• Track the Fair Value of your stocks
Have feedback on this article? Concerned about the content? Get in touch with us directly. Alternatively, email editorial-team@simplywallst.com
About TSE:8381
San-in Godo BankLtd
Engages in the provision of various banking products and services for individuals and corporate customers in Japan.
Adequate balance sheet average dividend payer.
Market Insights

Advertisement
Community Narratives
MINISO's fair value is projected at 26.69 with an anticipated PE ratio shift of 20x
Fair Value US$24.03|9.0% undervalued
BE
Community Contributor
Procter & Gamble: A Dividend Giant Facing Slowing Growth
Fair Value US$119.81|23.5% overvalued
AN
Community Contributor
Eli Lilly's Future Growth Driven by Tirzepatide and Favorable Market Conditions
Fair Value US$1.19k|14.4% undervalued
EA
Community Contributor