Advertisement
Yokohama Financial Group (TSE:7186): Valuation Insights Following Upgraded Guidance and Share Buyback

Simply Wall St
Reviewed by Simply Wall St
Yokohama Financial Group (TSE:7186) is in the spotlight after revising its earnings and dividend forecasts upward for the fiscal year ending March 2026. The company also introduced a share buyback program, which points to strong management confidence.
See our latest analysis for Yokohama Financial Group.
The upbeat earnings and dividend guidance, combined with the fresh share buyback, has energized investor sentiment. Yokohama Financial Group’s share price jumped 6.2% today and is now up an impressive 41% year-to-date. Zooming out, momentum has been building for some time, as the total shareholder return has soared 42% over the past 12 months and a remarkable 278% over five years.
If this kind of strong momentum has you looking for your next idea, it may be the perfect moment to widen your search and discover fast growing stocks with high insider ownership
With shares surging and management ramping up forecasts, investors now need to ask if Yokohama Financial Group is still undervalued, or if the market is already factoring in all those gains and future growth prospects.
Price-to-Earnings of 16.8x: Is it justified?
Yokohama Financial Group is trading at a price-to-earnings (P/E) ratio of 16.8x, putting it above both its industry average and what regression models estimate as a fair multiple. With shares closing at ¥1,228.5 most recently, the market appears to be pricing future earnings growth at a premium.
The price-to-earnings ratio is a key measure, reflecting how much investors are willing to pay today for a single unit of the company's earnings. For a bank like Yokohama Financial Group, the P/E ratio signals sentiment about growth outlook and profitability relative to sector norms.
Currently, the stock’s P/E of 16.8x is not only higher than the Japanese Banks industry average of 11.3x, but also above the peer average of 16.7x. Regression analysis suggests a fair P/E would be closer to 14.3x, indicating that expectations are running especially high. If the market adjusts closer to this fair value, it could be a notable shift for investors to monitor.
Explore the SWS fair ratio for Yokohama Financial Group
Result: Price-to-Earnings of 16.8x (OVERVALUED)
However, future performance could be challenged by slower than expected revenue growth or if projections for net income do not materialize as management anticipates.
Find out about the key risks to this Yokohama Financial Group narrative.
Another View: Discounted Cash Flow Analysis
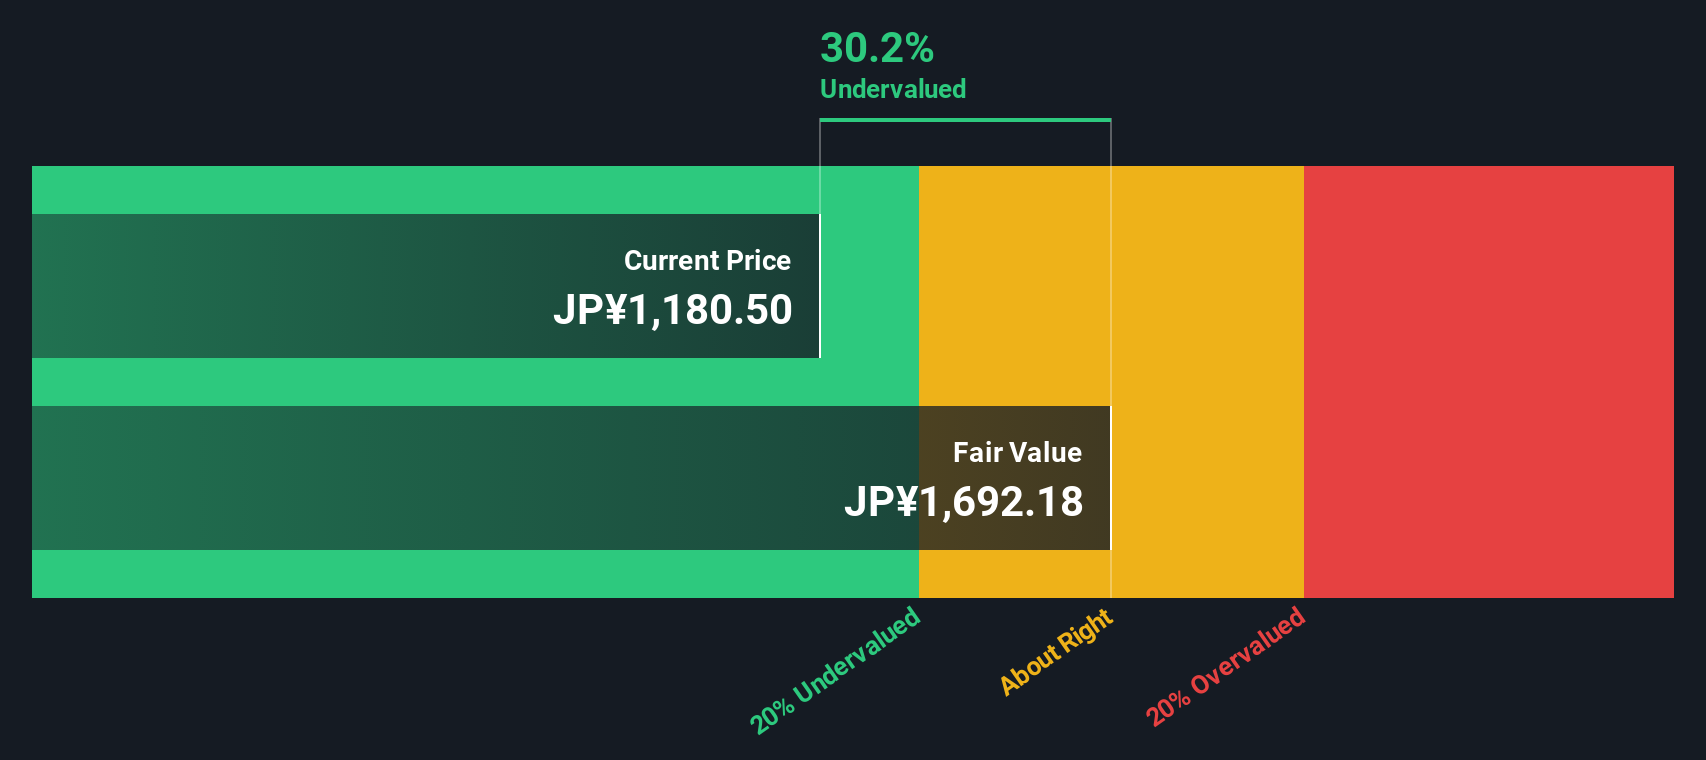
While the price-to-earnings ratio paints Yokohama Financial Group as overvalued compared to peers, our SWS DCF model tells a different story. According to this approach, the stock is trading 27.4% below its estimated fair value. This suggests it could actually be undervalued. Could the market be overlooking something important?
Look into how the SWS DCF model arrives at its fair value.
Simply Wall St performs a discounted cash flow (DCF) on every stock in the world every day (check out Yokohama Financial Group for example). We show the entire calculation in full. You can track the result in your watchlist or portfolio and be alerted when this changes, or use our stock screener to discover 878 undervalued stocks based on their cash flows. If you save a screener we even alert you when new companies match - so you never miss a potential opportunity.
Build Your Own Yokohama Financial Group Narrative
If you see things differently or want to chart your own course, you can easily build and share your perspective in just a few minutes. Do it your way
A great starting point for your Yokohama Financial Group research is our analysis highlighting 3 key rewards and 1 important warning sign that could impact your investment decision.
Looking for more investment ideas?
Why limit your options to just one stock? Get ahead of the crowd by tapping into other potential winners using the Simply Wall Street Screener.
- Boost your portfolio’s income by exploring these 16 dividend stocks with yields > 3% offering attractive yields above 3% that stand out in today’s market.
- Tap into the power of disruption and discover how these 25 AI penny stocks are changing industries with innovative technology and rapid growth.
- Add an edge to your research as you identify undervalued opportunities through these 878 undervalued stocks based on cash flows that could be the hidden gems everyone else is missing.
This article by Simply Wall St is general in nature. We provide commentary based on historical data and analyst forecasts only using an unbiased methodology and our articles are not intended to be financial advice. It does not constitute a recommendation to buy or sell any stock, and does not take account of your objectives, or your financial situation. We aim to bring you long-term focused analysis driven by fundamental data. Note that our analysis may not factor in the latest price-sensitive company announcements or qualitative material. Simply Wall St has no position in any stocks mentioned.
New: Manage All Your Stock Portfolios in One Place
We've created the ultimate portfolio companion for stock investors, and it's free.
• Connect an unlimited number of Portfolios and see your total in one currency
• Be alerted to new Warning Signs or Risks via email or mobile
• Track the Fair Value of your stocks
Have feedback on this article? Concerned about the content? Get in touch with us directly. Alternatively, email editorial-team@simplywallst.com
About TSE:7186
Yokohama Financial Group
Provides various banking products and services to small and medium-sized businesses and individuals in Japan and internationally.
Solid track record with excellent balance sheet.
Similar Companies
Market Insights

Advertisement
Community Narratives
MINISO's fair value is projected at 26.69 with an anticipated PE ratio shift of 20x
Fair Value US$24.03|11.0% undervalued
BE
Community Contributor
Procter & Gamble: A Dividend Giant Facing Slowing Growth
Fair Value US$119.81|23.3% overvalued
AN
Community Contributor
Eli Lilly's Future Growth Driven by Tirzepatide and Favorable Market Conditions
Fair Value US$1.19k|13.8% undervalued
EA
Community Contributor