
Advertisement
What trends should we look for it we want to identify stocks that can multiply in value over the long term? In a perfect world, we'd like to see a company investing more capital into its business and ideally the returns earned from that capital are also increasing. This shows us that it's a compounding machine, able to continually reinvest its earnings back into the business and generate higher returns. However, after briefly looking over the numbers, we don't think TS TECH (TSE:7313) has the makings of a multi-bagger going forward, but let's have a look at why that may be.
Return On Capital Employed (ROCE): What Is It?
Just to clarify if you're unsure, ROCE is a metric for evaluating how much pre-tax income (in percentage terms) a company earns on the capital invested in its business. To calculate this metric for TS TECH, this is the formula:
Return on Capital Employed = Earnings Before Interest and Tax (EBIT) ÷ (Total Assets - Current Liabilities)
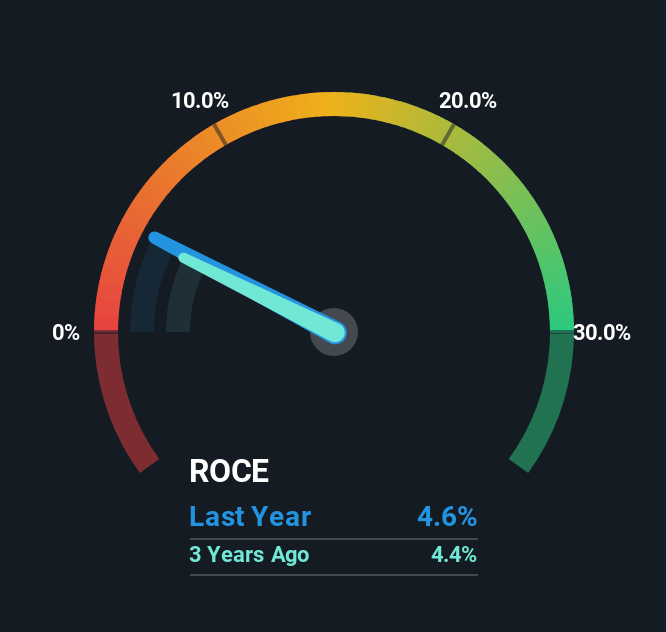
0.046 = JP¥15b ÷ (JP¥418b - JP¥90b) (Based on the trailing twelve months to June 2025).
Therefore, TS TECH has an ROCE of 4.6%. Ultimately, that's a low return and it under-performs the Auto Components industry average of 7.6%.
See our latest analysis for TS TECH
In the above chart we have measured TS TECH's prior ROCE against its prior performance, but the future is arguably more important. If you're interested, you can view the analysts predictions in our free analyst report for TS TECH .
What Can We Tell From TS TECH's ROCE Trend?
Over the past five years, TS TECH's ROCE and capital employed have both remained mostly flat. It's not uncommon to see this when looking at a mature and stable business that isn't re-investing its earnings because it has likely passed that phase of the business cycle. With that in mind, unless investment picks up again in the future, we wouldn't expect TS TECH to be a multi-bagger going forward.
In Conclusion...
In a nutshell, TS TECH has been trudging along with the same returns from the same amount of capital over the last five years. Since the stock has gained an impressive 54% over the last five years, investors must think there's better things to come. Ultimately, if the underlying trends persist, we wouldn't hold our breath on it being a multi-bagger going forward.
One final note, you should learn about the 2 warning signs we've spotted with TS TECH (including 1 which is a bit concerning) .
For those who like to invest in solid companies, check out this free list of companies with solid balance sheets and high returns on equity.
Valuation is complex, but we're here to simplify it.
Discover if TS TECH might be undervalued or overvalued with our detailed analysis, featuring fair value estimates, potential risks, dividends, insider trades, and its financial condition.
Access Free AnalysisHave feedback on this article? Concerned about the content? Get in touch with us directly. Alternatively, email editorial-team (at) simplywallst.com.
This article by Simply Wall St is general in nature. We provide commentary based on historical data and analyst forecasts only using an unbiased methodology and our articles are not intended to be financial advice. It does not constitute a recommendation to buy or sell any stock, and does not take account of your objectives, or your financial situation. We aim to bring you long-term focused analysis driven by fundamental data. Note that our analysis may not factor in the latest price-sensitive company announcements or qualitative material. Simply Wall St has no position in any stocks mentioned.
About TSE:7313
TS TECH
Engages in development, manufacture, and sale of seats for automobiles.
Flawless balance sheet average dividend payer.
Similar Companies
Market Insights

Advertisement
Community Narratives
MicroVision will explode future revenue by 380.37% with a vision towards success
Fair Value US$60.00|98.4% undervalued
TH
Community Contributor
The Indispensable Artery for a New North American Economy
Fair Value CA$132.87|1.3% undervalued
TI
Community Contributor