
Advertisement
- Japan
- /
- Auto Components
- /
- TSE:7229
Yutaka Giken Co.,Ltd. (TSE:7229) Held Back By Insufficient Growth Even After Shares Climb 26%
Yutaka Giken Co.,Ltd. (TSE:7229) shareholders have had their patience rewarded with a 26% share price jump in the last month. Looking further back, the 19% rise over the last twelve months isn't too bad notwithstanding the strength over the last 30 days.
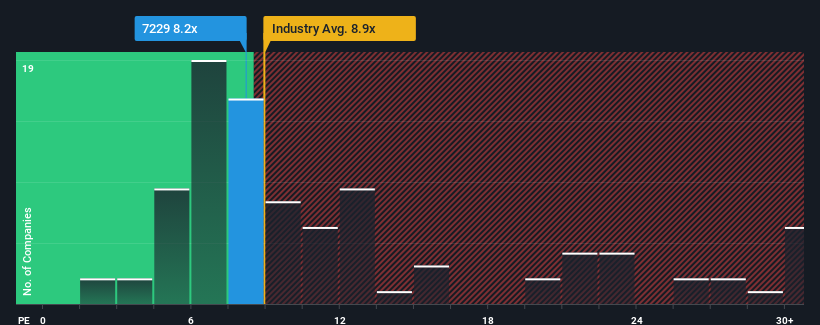
In spite of the firm bounce in price, Yutaka GikenLtd may still be sending bullish signals at the moment with its price-to-earnings (or "P/E") ratio of 8.2x, since almost half of all companies in Japan have P/E ratios greater than 13x and even P/E's higher than 21x are not unusual. However, the P/E might be low for a reason and it requires further investigation to determine if it's justified.
For example, consider that Yutaka GikenLtd's financial performance has been poor lately as its earnings have been in decline. One possibility is that the P/E is low because investors think the company won't do enough to avoid underperforming the broader market in the near future. If you like the company, you'd be hoping this isn't the case so that you could potentially pick up some stock while it's out of favour.
See our latest analysis for Yutaka GikenLtd
How Is Yutaka GikenLtd's Growth Trending?
The only time you'd be truly comfortable seeing a P/E as low as Yutaka GikenLtd's is when the company's growth is on track to lag the market.
Retrospectively, the last year delivered a frustrating 39% decrease to the company's bottom line. This has erased any of its gains during the last three years, with practically no change in EPS being achieved in total. So it appears to us that the company has had a mixed result in terms of growing earnings over that time.
Weighing that recent medium-term earnings trajectory against the broader market's one-year forecast for expansion of 9.3% shows it's noticeably less attractive on an annualised basis.
In light of this, it's understandable that Yutaka GikenLtd's P/E sits below the majority of other companies. It seems most investors are expecting to see the recent limited growth rates continue into the future and are only willing to pay a reduced amount for the stock.
The Key Takeaway
The latest share price surge wasn't enough to lift Yutaka GikenLtd's P/E close to the market median. It's argued the price-to-earnings ratio is an inferior measure of value within certain industries, but it can be a powerful business sentiment indicator.
We've established that Yutaka GikenLtd maintains its low P/E on the weakness of its recent three-year growth being lower than the wider market forecast, as expected. At this stage investors feel the potential for an improvement in earnings isn't great enough to justify a higher P/E ratio. If recent medium-term earnings trends continue, it's hard to see the share price rising strongly in the near future under these circumstances.
You should always think about risks. Case in point, we've spotted 1 warning sign for Yutaka GikenLtd you should be aware of.
If you're unsure about the strength of Yutaka GikenLtd's business, why not explore our interactive list of stocks with solid business fundamentals for some other companies you may have missed.
New: Manage All Your Stock Portfolios in One Place
We've created the ultimate portfolio companion for stock investors, and it's free.
• Connect an unlimited number of Portfolios and see your total in one currency
• Be alerted to new Warning Signs or Risks via email or mobile
• Track the Fair Value of your stocks
Have feedback on this article? Concerned about the content? Get in touch with us directly. Alternatively, email editorial-team (at) simplywallst.com.
This article by Simply Wall St is general in nature. We provide commentary based on historical data and analyst forecasts only using an unbiased methodology and our articles are not intended to be financial advice. It does not constitute a recommendation to buy or sell any stock, and does not take account of your objectives, or your financial situation. We aim to bring you long-term focused analysis driven by fundamental data. Note that our analysis may not factor in the latest price-sensitive company announcements or qualitative material. Simply Wall St has no position in any stocks mentioned.
About TSE:7229
Yutaka GikenLtd
Manufactures and sells automobile parts in Japan, North America, China, Asia, and internationally.
Flawless balance sheet average dividend payer.
Market Insights

Advertisement
Community Narratives
MINISO's fair value is projected at 26.69 with an anticipated PE ratio shift of 20x
Fair Value US$24.03|11.0% undervalued
BE
Community Contributor
Procter & Gamble: A Dividend Giant Facing Slowing Growth
Fair Value US$119.81|23.3% overvalued
AN
Community Contributor
Eli Lilly's Future Growth Driven by Tirzepatide and Favorable Market Conditions
Fair Value US$1.19k|13.8% undervalued
EA
Community Contributor