Advertisement
- Japan
- /
- Auto Components
- /
- TSE:6473
JTEKT (TSE:6473): Assessing Valuation After Strong Yearly Shareholder Returns

Simply Wall St
Reviewed by Kshitija Bhandaru
JTEKT (TSE:6473) shares have shown a mix of short-term pullback and longer-term strength, with returns over the past month trailing the overall yearly performance. Investors might want to look further into what is driving this pattern.
See our latest analysis for JTEKT.
Shares may have cooled off over the past month, but JTEKT’s 1-year total shareholder return of 48% and strong year-to-date momentum suggest that underlying optimism remains. The stock continues to ride a wave of improving fundamentals, even as short-term sentiment shifts.
If JTEKT’s momentum has you thinking about what else could be on the move, it might be time to expand your watchlist and discover See the full list for free.
With the stock trading below analyst targets while still boasting impressive gains, the key question is whether JTEKT remains undervalued or if the market has already factored in its future growth potential.
Price-to-Earnings of 48.5x: Is it justified?
Compared to both its peers and industry, JTEKT commands a notably high price-to-earnings (P/E) ratio of 48.5x, well above the most recent closing price’s implied valuation. This places the stock in overvalued territory when judged through the lens of earnings multiples.
The P/E ratio measures how much investors are willing to pay today for a unit of current earnings, making it a key yardstick for companies in the industrial and auto components sectors. It is particularly relevant here, as JTEKT’s earnings trajectory and market positioning are under scrutiny after a year of negative profit growth. A P/E of 48.5x signals that investors are banking on a sizable recovery in profitability, or perhaps rewarding anticipated structural improvements.
However, a P/E of 48.5x is not just elevated; it is more than four times the JP Auto Components industry average of 11.6x and well above the peer group’s 14x. The implied premium suggests the current market price reflects a high degree of optimism, likely more than what recent results would justify. Even compared to the estimated fair P/E ratio of 35.5x, the stock looks stretched, potentially leaving room for downward multiple contraction if future improvements do not materialize quickly.
Explore the SWS fair ratio for JTEKT
Result: Price-to-Earnings of 48.5x (OVERVALUED)
However, slowing revenue growth and a high valuation leave JTEKT vulnerable if profit recovery falters or if broader market sentiment shifts toward a more defensive stance.
Find out about the key risks to this JTEKT narrative.
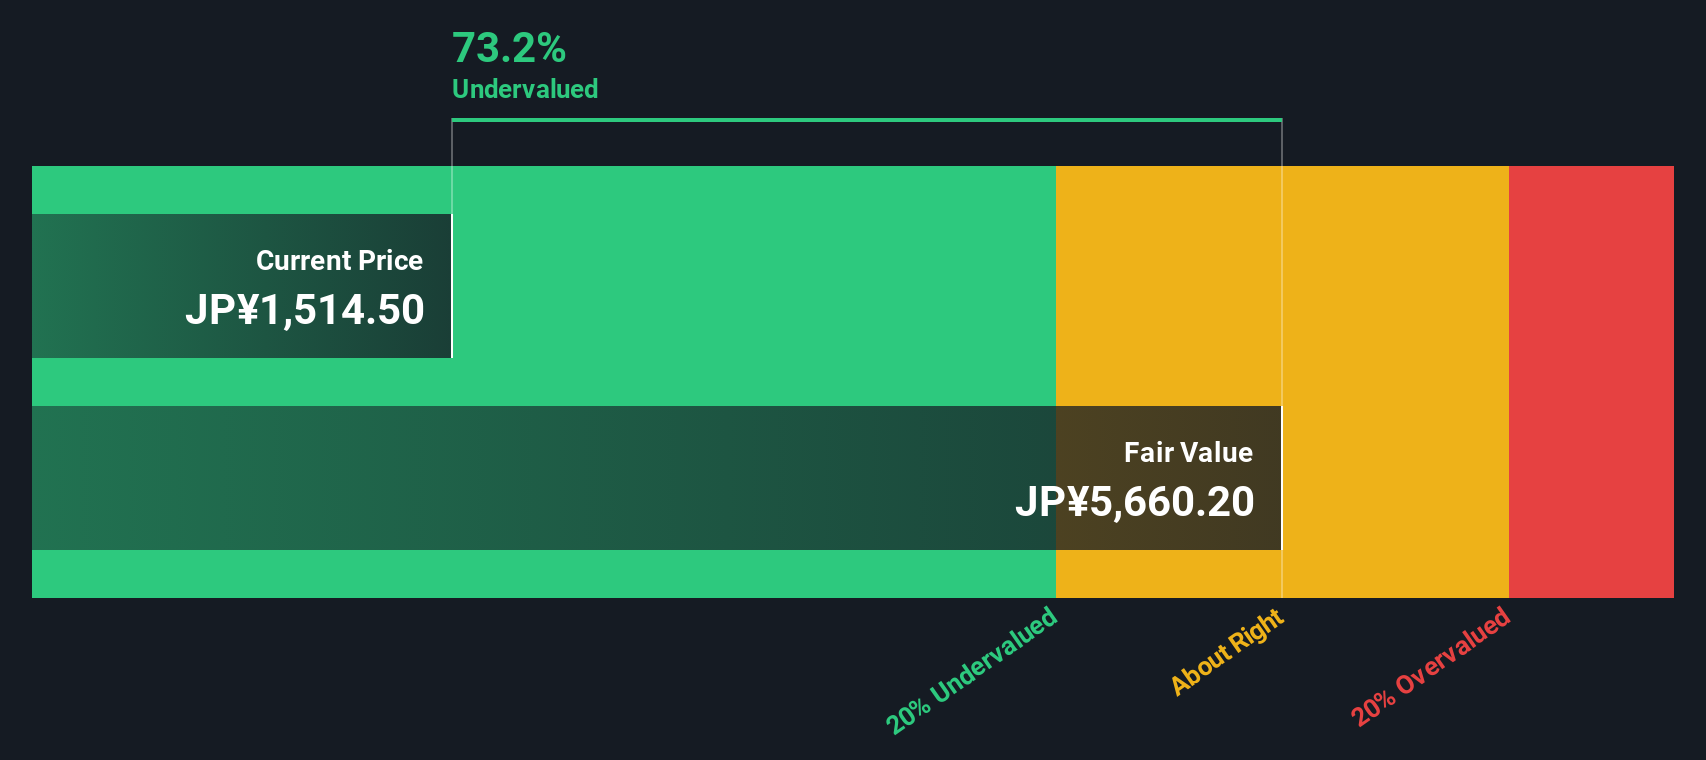
Another View: Discounted Cash Flow Shows Undervaluation
While earnings multiples paint JTEKT as expensive, our SWS DCF model signals the opposite. By estimating JTEKT’s future cash flows, this approach finds that the shares trade at a deep 71% discount to fair value. Do earnings multiples overlook real long-term value, or is the DCF model too optimistic?
Look into how the SWS DCF model arrives at its fair value.
Simply Wall St performs a discounted cash flow (DCF) on every stock in the world every day (check out JTEKT for example). We show the entire calculation in full. You can track the result in your watchlist or portfolio and be alerted when this changes, or use our stock screener to discover undervalued stocks based on their cash flows. If you save a screener we even alert you when new companies match - so you never miss a potential opportunity.
Build Your Own JTEKT Narrative
If you want to reach your own conclusions or have a different take on JTEKT, it only takes a few minutes to generate your own analysis. Do it your way.
A great starting point for your JTEKT research is our analysis highlighting 2 key rewards and 2 important warning signs that could impact your investment decision.
Looking for More Opportunities Beyond JTEKT?
Act now to uncover bold investment ideas you might be missing. Simply Wall St’s screener tools give you an edge to spot hidden leaders and ride powerful trends.
- Tap into reliable, high-yield companies by checking out these 18 dividend stocks with yields > 3% for steady income streams above 3%.
- Explore the innovation wave in healthcare by searching these 33 healthcare AI stocks, which is at the forefront of AI-driven medical breakthroughs.
- Accelerate your portfolio’s growth with these 24 AI penny stocks that are shaping tomorrow’s technology landscape.
This article by Simply Wall St is general in nature. We provide commentary based on historical data and analyst forecasts only using an unbiased methodology and our articles are not intended to be financial advice. It does not constitute a recommendation to buy or sell any stock, and does not take account of your objectives, or your financial situation. We aim to bring you long-term focused analysis driven by fundamental data. Note that our analysis may not factor in the latest price-sensitive company announcements or qualitative material. Simply Wall St has no position in any stocks mentioned.
New: Manage All Your Stock Portfolios in One Place
We've created the ultimate portfolio companion for stock investors, and it's free.
• Connect an unlimited number of Portfolios and see your total in one currency
• Be alerted to new Warning Signs or Risks via email or mobile
• Track the Fair Value of your stocks
Have feedback on this article? Concerned about the content? Get in touch with us directly. Alternatively, email editorial-team@simplywallst.com
About TSE:6473
JTEKT
Manufactures and sells steering systems, driveline components, bearings, machine tools, electronic control devices, and home accessory equipment.
Excellent balance sheet with moderate growth potential.
Similar Companies
Market Insights

Advertisement
Community Narratives
Finding The True Value Of A Logistics Powerhouse
Fair Value US$95.21|8.4% undervalued
NV
Community Contributor
Paradigm Biopharmaceuticals Will Lead Osteoarthritis Treatment with Zilosul's FDA Success
Fair Value AU$5.50|92.1% undervalued
AM
Community Contributor
Barrick Mining (ABX:CA): A Gold Hedge against a U.S. Shutdown
Fair Value CA$60.00|24.2% undervalued
GM
Community Contributor