- Japan
- /
- Auto Components
- /
- TSE:5161
3 Dividend Stocks To Consider With Yields Up To 4.7%

Reviewed by Simply Wall St
As global markets navigate through heightened inflation and interest rate expectations, U.S. stock indexes are approaching record highs, buoyed by investor optimism following policy decisions that have temporarily eased trade tensions. In this environment of economic uncertainty and market volatility, dividend stocks can offer a measure of stability through consistent income streams, making them an attractive consideration for investors seeking to balance growth with income.
Top 10 Dividend Stocks
| Name | Dividend Yield | Dividend Rating |
| Guaranty Trust Holding (NGSE:GTCO) | 5.87% | ★★★★★★ |
| Chongqing Rural Commercial Bank (SEHK:3618) | 8.33% | ★★★★★★ |
| Padma Oil (DSE:PADMAOIL) | 7.51% | ★★★★★★ |
| Peoples Bancorp (NasdaqGS:PEBO) | 4.90% | ★★★★★★ |
| Tsubakimoto Chain (TSE:6371) | 4.32% | ★★★★★★ |
| CAC Holdings (TSE:4725) | 3.95% | ★★★★★★ |
| Citizens & Northern (NasdaqCM:CZNC) | 5.23% | ★★★★★★ |
| Southside Bancshares (NYSE:SBSI) | 4.60% | ★★★★★★ |
| China South Publishing & Media Group (SHSE:601098) | 4.04% | ★★★★★★ |
| HUAYU Automotive Systems (SHSE:600741) | 4.36% | ★★★★★★ |
Click here to see the full list of 1986 stocks from our Top Dividend Stocks screener.
Let's dive into some prime choices out of the screener.
Sanki Engineering (TSE:1961)
Simply Wall St Dividend Rating: ★★★★☆☆
Overview: Sanki Engineering Co., Ltd. offers a range of social infrastructure services both in Japan and internationally, with a market cap of ¥176.98 billion.
Operations: Sanki Engineering Co., Ltd. generates revenue through its diverse social infrastructure services offered in Japan and globally.
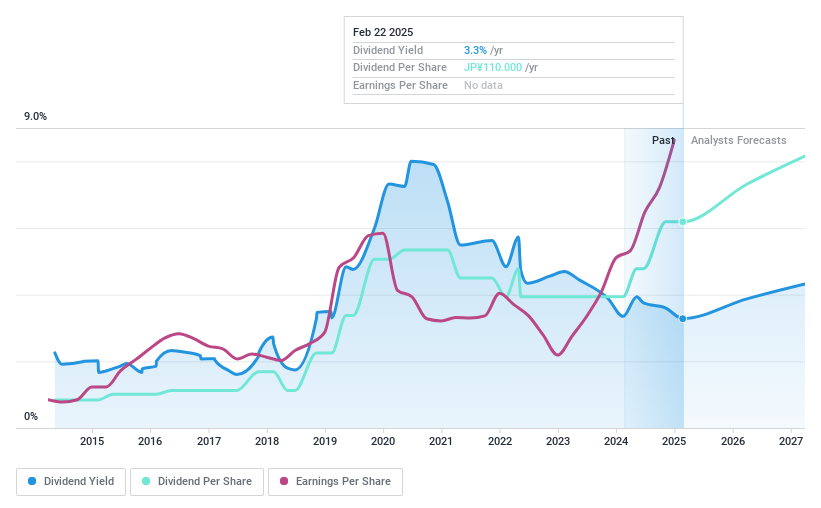
Dividend Yield: 3.1%
Sanki Engineering's dividend payments are well-supported by a low payout ratio of 13% and a cash payout ratio of 32%, ensuring sustainability. Despite earnings growth of 65.2% last year, the dividend yield is modest at 3.14%, below Japan's top-tier payers. The company has an unstable dividend history with volatility over the past decade but has shown growth in payouts during this period. Recent share buybacks totaling ¥2.21 billion may signal confidence in financial stability.
- Unlock comprehensive insights into our analysis of Sanki Engineering stock in this dividend report.
- Insights from our recent valuation report point to the potential overvaluation of Sanki Engineering shares in the market.
Nishikawa Rubber (TSE:5161)
Simply Wall St Dividend Rating: ★★★★★★
Overview: Nishikawa Rubber Co., Ltd. manufactures and sells rubber and sealing products both in Japan and internationally, with a market cap of ¥94.15 billion.
Operations: Nishikawa Rubber Co., Ltd. generates revenue from various regions, with ¥55.83 billion from Japan, ¥10.98 billion from East Asia, ¥41.09 billion from North America, and ¥12.59 billion from Southeast Asia.
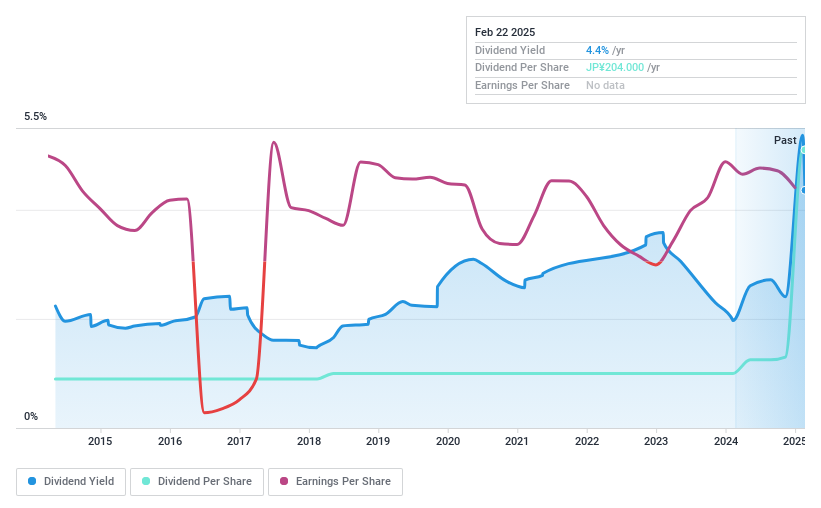
Dividend Yield: 4.1%
Nishikawa Rubber offers a compelling dividend profile with stable and growing payments over the past decade. Its dividends are well-covered, supported by a low payout ratio of 22.6% and a cash payout ratio of 43.4%, indicating sustainability. Trading at 38.5% below estimated fair value, it provides an attractive yield of 4.13%, placing it among Japan's top dividend payers despite recent share price volatility over the last three months.
- Click here to discover the nuances of Nishikawa Rubber with our detailed analytical dividend report.
- Our valuation report unveils the possibility Nishikawa Rubber's shares may be trading at a premium.
Hanpin Electron (TWSE:2488)
Simply Wall St Dividend Rating: ★★★★★☆
Overview: Hanpin Electron Co., Ltd. is involved in the design, manufacture, and sale of electronic consumer products, professional audio products, and DJ equipment across Taiwan, China, Hong Kong, and Singapore with a market cap of NT$4.48 billion.
Operations: Hanpin Electron Co., Ltd. generates revenue primarily from its Audio Department, which accounted for NT$2.76 billion.
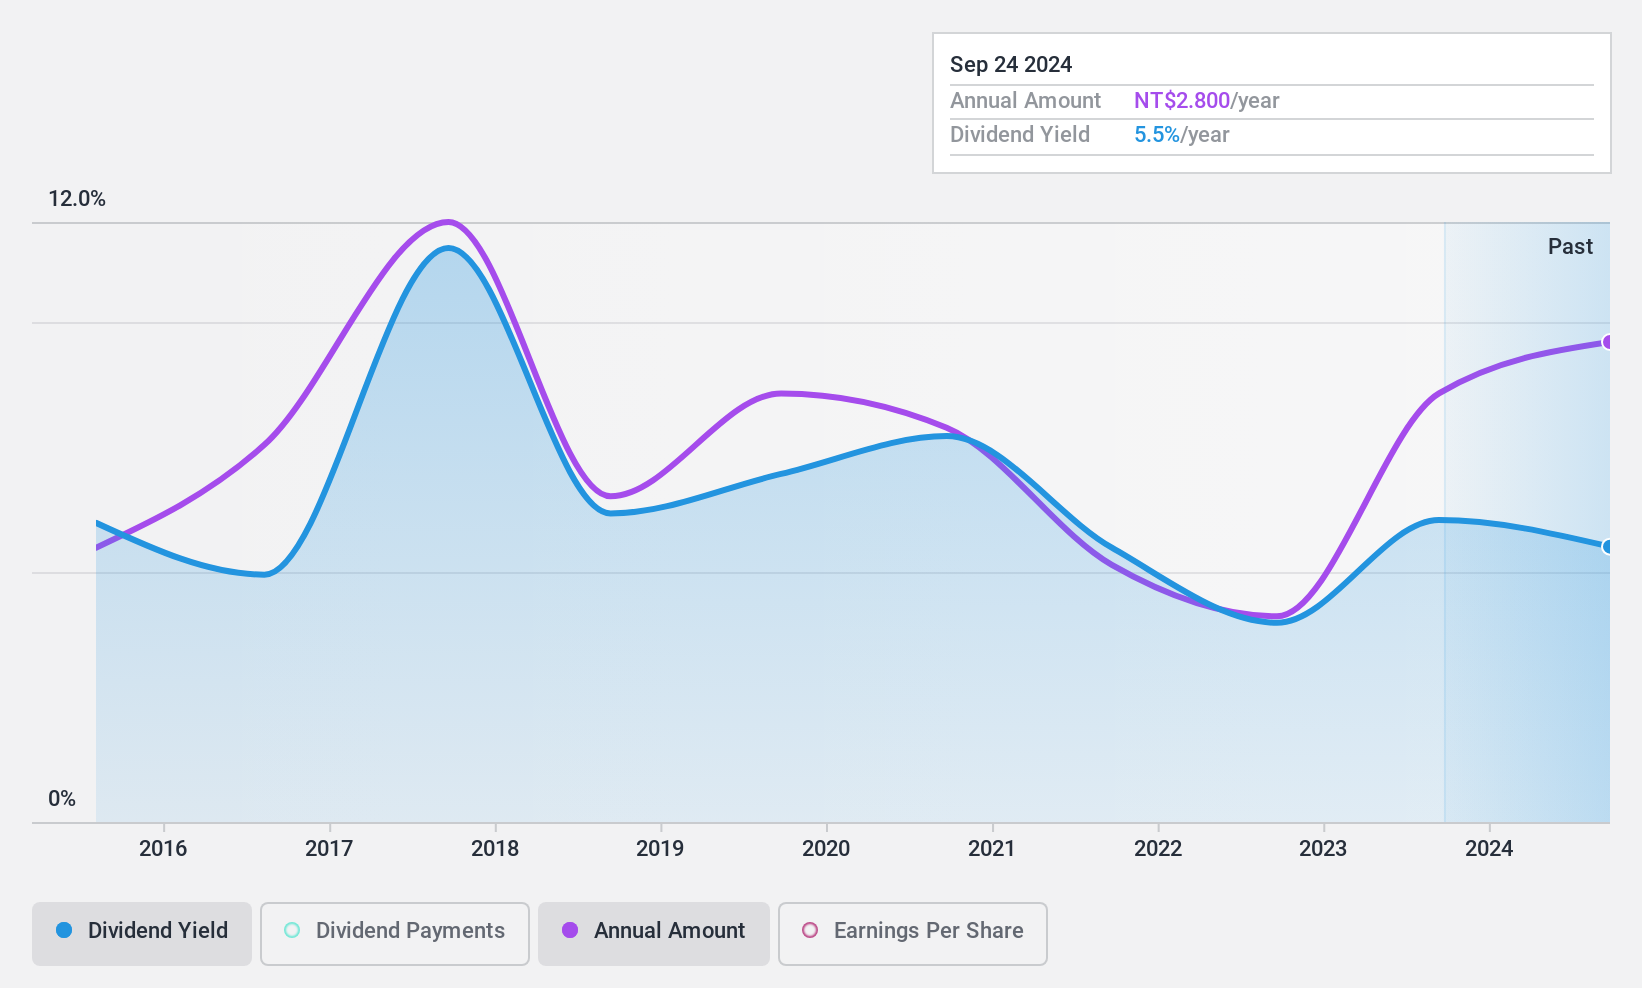
Dividend Yield: 4.8%
Hanpin Electron's dividend yield of 4.75% ranks in the top 25% within Taiwan, yet its payments have been volatile and unreliable over the past decade. Despite this instability, dividends are well-covered by both earnings and cash flows, with a payout ratio of 60.1% and a cash payout ratio of 24.7%. Trading significantly below estimated fair value, Hanpin's earnings growth at 13.7% annually over five years supports potential dividend sustainability despite past volatility.
- Delve into the full analysis dividend report here for a deeper understanding of Hanpin Electron.
- Our expertly prepared valuation report Hanpin Electron implies its share price may be lower than expected.
Summing It All Up
- Dive into all 1986 of the Top Dividend Stocks we have identified here.
- Are any of these part of your asset mix? Tap into the analytical power of Simply Wall St's portfolio to get a 360-degree view on how they're shaping up.
- Simply Wall St is a revolutionary app designed for long-term stock investors, it's free and covers every market in the world.
Ready To Venture Into Other Investment Styles?
- Explore high-performing small cap companies that haven't yet garnered significant analyst attention.
- Fuel your portfolio with companies showing strong growth potential, backed by optimistic outlooks both from analysts and management.
- Find companies with promising cash flow potential yet trading below their fair value.
This article by Simply Wall St is general in nature. We provide commentary based on historical data and analyst forecasts only using an unbiased methodology and our articles are not intended to be financial advice. It does not constitute a recommendation to buy or sell any stock, and does not take account of your objectives, or your financial situation. We aim to bring you long-term focused analysis driven by fundamental data. Note that our analysis may not factor in the latest price-sensitive company announcements or qualitative material. Simply Wall St has no position in any stocks mentioned.
The New Payments ETF Is Live on NASDAQ:
Money is moving to real-time rails, and a newly listed ETF now gives investors direct exposure. Fast settlement. Institutional custody. Simple access.
Explore how this launch could reshape portfolios
Sponsored ContentValuation is complex, but we're here to simplify it.
Discover if Nishikawa Rubber might be undervalued or overvalued with our detailed analysis, featuring fair value estimates, potential risks, dividends, insider trades, and its financial condition.
Access Free AnalysisHave feedback on this article? Concerned about the content? Get in touch with us directly. Alternatively, email editorial-team@simplywallst.com
About TSE:5161
Nishikawa Rubber
Manufactures and sells rubber and sealing products in Japan and internationally.
Excellent balance sheet with proven track record and pays a dividend.
Market Insights

Weekly Picks

Early mover in a fast growing industry. Likely to experience share price volatility as they scale


A case for CA$31.80 (undiluted), aka 8,616% upside from CA$0.37 (an 86 bagger!).


Moderation and Stabilisation: HOLD: Fair Price based on a 4-year Cycle is $12.08
Recently Updated Narratives

Amazon: Why the World’s Biggest Platform Still Runs on Invisible Economics

Sunrun Stock: When the Energy Transition Collides With the Cost of Capital

Salesforce Stock: AI-Fueled Growth Is Real — But Can Margins Stay This Strong?
Popular Narratives


MicroVision will explode future revenue by 380.37% with a vision towards success


Crazy Undervalued 42 Baggers Silver Play (Active & Running Mine)


