
Advertisement
- Japan
- /
- Auto Components
- /
- TSE:3569
Declining Stock and Solid Fundamentals: Is The Market Wrong About Seiren Co.,Ltd. (TSE:3569)?
It is hard to get excited after looking at SeirenLtd's (TSE:3569) recent performance, when its stock has declined 9.7% over the past three months. But if you pay close attention, you might gather that its strong financials could mean that the stock could potentially see an increase in value in the long-term, given how markets usually reward companies with good financial health. Specifically, we decided to study SeirenLtd's ROE in this article.
Return on equity or ROE is a key measure used to assess how efficiently a company's management is utilizing the company's capital. In other words, it is a profitability ratio which measures the rate of return on the capital provided by the company's shareholders.
How Do You Calculate Return On Equity?
Return on equity can be calculated by using the formula:
Return on Equity = Net Profit (from continuing operations) ÷ Shareholders' Equity
So, based on the above formula, the ROE for SeirenLtd is:
9.7% = JP¥14b ÷ JP¥144b (Based on the trailing twelve months to March 2025).
The 'return' is the amount earned after tax over the last twelve months. Another way to think of that is that for every ¥1 worth of equity, the company was able to earn ¥0.10 in profit.
View our latest analysis for SeirenLtd
What Is The Relationship Between ROE And Earnings Growth?
So far, we've learned that ROE is a measure of a company's profitability. We now need to evaluate how much profit the company reinvests or "retains" for future growth which then gives us an idea about the growth potential of the company. Assuming everything else remains unchanged, the higher the ROE and profit retention, the higher the growth rate of a company compared to companies that don't necessarily bear these characteristics.
SeirenLtd's Earnings Growth And 9.7% ROE
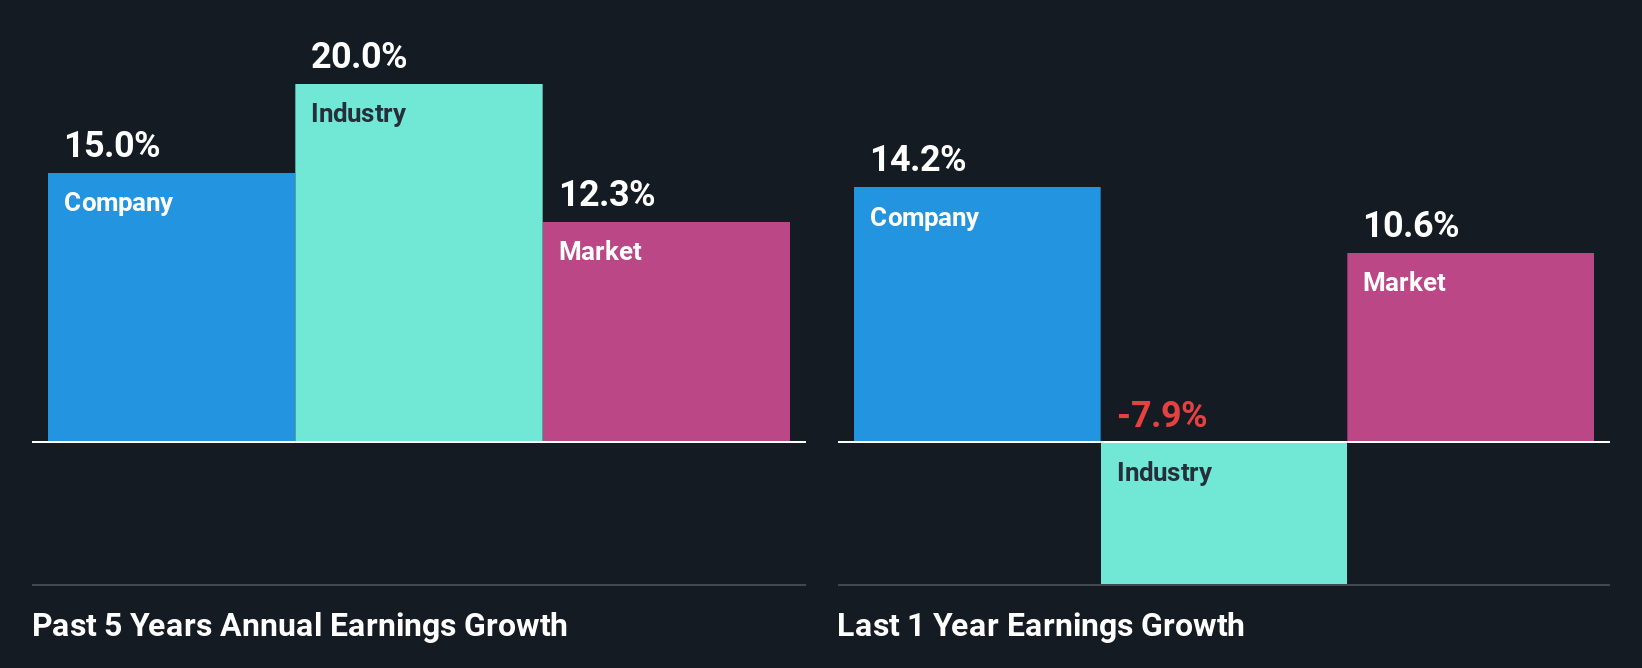
At first glance, SeirenLtd seems to have a decent ROE. Especially when compared to the industry average of 6.4% the company's ROE looks pretty impressive. This certainly adds some context to SeirenLtd's decent 15% net income growth seen over the past five years.
We then compared SeirenLtd's net income growth with the industry and found that the company's growth figure is lower than the average industry growth rate of 20% in the same 5-year period, which is a bit concerning.
The basis for attaching value to a company is, to a great extent, tied to its earnings growth. What investors need to determine next is if the expected earnings growth, or the lack of it, is already built into the share price. By doing so, they will have an idea if the stock is headed into clear blue waters or if swampy waters await. Is 3569 fairly valued? This infographic on the company's intrinsic value has everything you need to know.
Is SeirenLtd Efficiently Re-investing Its Profits?
SeirenLtd has a low three-year median payout ratio of 23%, meaning that the company retains the remaining 77% of its profits. This suggests that the management is reinvesting most of the profits to grow the business.
Moreover, SeirenLtd is determined to keep sharing its profits with shareholders which we infer from its long history of paying a dividend for at least ten years.
Summary
On the whole, we feel that SeirenLtd's performance has been quite good. Particularly, we like that the company is reinvesting heavily into its business, and at a high rate of return. As a result, the decent growth in its earnings is not surprising. With that said, the latest industry analyst forecasts reveal that the company's earnings growth is expected to slow down. Are these analysts expectations based on the broad expectations for the industry, or on the company's fundamentals? Click here to be taken to our analyst's forecasts page for the company.
New: Manage All Your Stock Portfolios in One Place
We've created the ultimate portfolio companion for stock investors, and it's free.
• Connect an unlimited number of Portfolios and see your total in one currency
• Be alerted to new Warning Signs or Risks via email or mobile
• Track the Fair Value of your stocks
Have feedback on this article? Concerned about the content? Get in touch with us directly. Alternatively, email editorial-team (at) simplywallst.com.
This article by Simply Wall St is general in nature. We provide commentary based on historical data and analyst forecasts only using an unbiased methodology and our articles are not intended to be financial advice. It does not constitute a recommendation to buy or sell any stock, and does not take account of your objectives, or your financial situation. We aim to bring you long-term focused analysis driven by fundamental data. Note that our analysis may not factor in the latest price-sensitive company announcements or qualitative material. Simply Wall St has no position in any stocks mentioned.
About TSE:3569
SeirenLtd
Manufactures and markets textile products, industrial machines, and electronic parts in Japan and internationally.
Flawless balance sheet established dividend payer.
Market Insights

Advertisement
Community Narratives
MINISO's fair value is projected at 26.69 with an anticipated PE ratio shift of 20x
Fair Value US$24.03|11.0% undervalued
BE
Community Contributor
Procter & Gamble: A Dividend Giant Facing Slowing Growth
Fair Value US$119.81|23.3% overvalued
AN
Community Contributor
Eli Lilly's Future Growth Driven by Tirzepatide and Favorable Market Conditions
Fair Value US$1.19k|13.8% undervalued
EA
Community Contributor