Advertisement
- Norway
- /
- Oil and Gas
- /
- OB:HUNT
Olidata Leads The Way In Our European Penny Stock Highlights

Simply Wall St
Reviewed by Simply Wall St
As European markets face a pullback, with the STOXX Europe 600 Index ending lower amid concerns about overvaluation in AI-related stocks, investors are increasingly exploring alternative opportunities. Penny stocks, though an outdated term, still represent smaller or newer companies that can offer significant value to those willing to look beyond the traditional market leaders. By focusing on those with solid financial foundations and potential for growth, investors might uncover promising opportunities among these lesser-known entities.
Top 10 Penny Stocks In Europe
| Name | Share Price | Market Cap | Rewards & Risks |
| Ariston Holding (BIT:ARIS) | €3.68 | €1.27B | ✅ 5 ⚠️ 2 View Analysis > |
| DigiTouch (BIT:DGT) | €2.01 | €27.77M | ✅ 3 ⚠️ 1 View Analysis > |
| Angler Gaming (NGM:ANGL) | SEK3.60 | SEK269.95M | ✅ 4 ⚠️ 2 View Analysis > |
| Angler Gaming (DB:0QM) | €0.37 | €242.95M | ✅ 3 ⚠️ 4 View Analysis > |
| Altri SGPS (ENXTLS:ALTR) | €4.87 | €998.99M | ✅ 3 ⚠️ 2 View Analysis > |
| Libertas 7 (BME:LIB) | €3.18 | €67.45M | ✅ 3 ⚠️ 3 View Analysis > |
| ForFarmers (ENXTAM:FFARM) | €4.515 | €399.06M | ✅ 4 ⚠️ 1 View Analysis > |
| Nurminen Logistics Oyj (HLSE:NLG1V) | €0.955 | €77.06M | ✅ 2 ⚠️ 4 View Analysis > |
| High (ENXTPA:HCO) | €3.97 | €77.66M | ✅ 1 ⚠️ 5 View Analysis > |
| Deceuninck (ENXTBR:DECB) | €2.09 | €288.88M | ✅ 4 ⚠️ 1 View Analysis > |
Click here to see the full list of 278 stocks from our European Penny Stocks screener.
Let's dive into some prime choices out of the screener.
Olidata (BIT:OLI)
Simply Wall St Financial Health Rating: ★★★★★☆
Overview: Olidata S.p.A. operates as a systems integration and technology consulting company with a market cap of €43.55 million.
Operations: The company's revenue is primarily derived from its Computer Hardware segment, totaling €72.23 million.
Market Cap: €43.55M
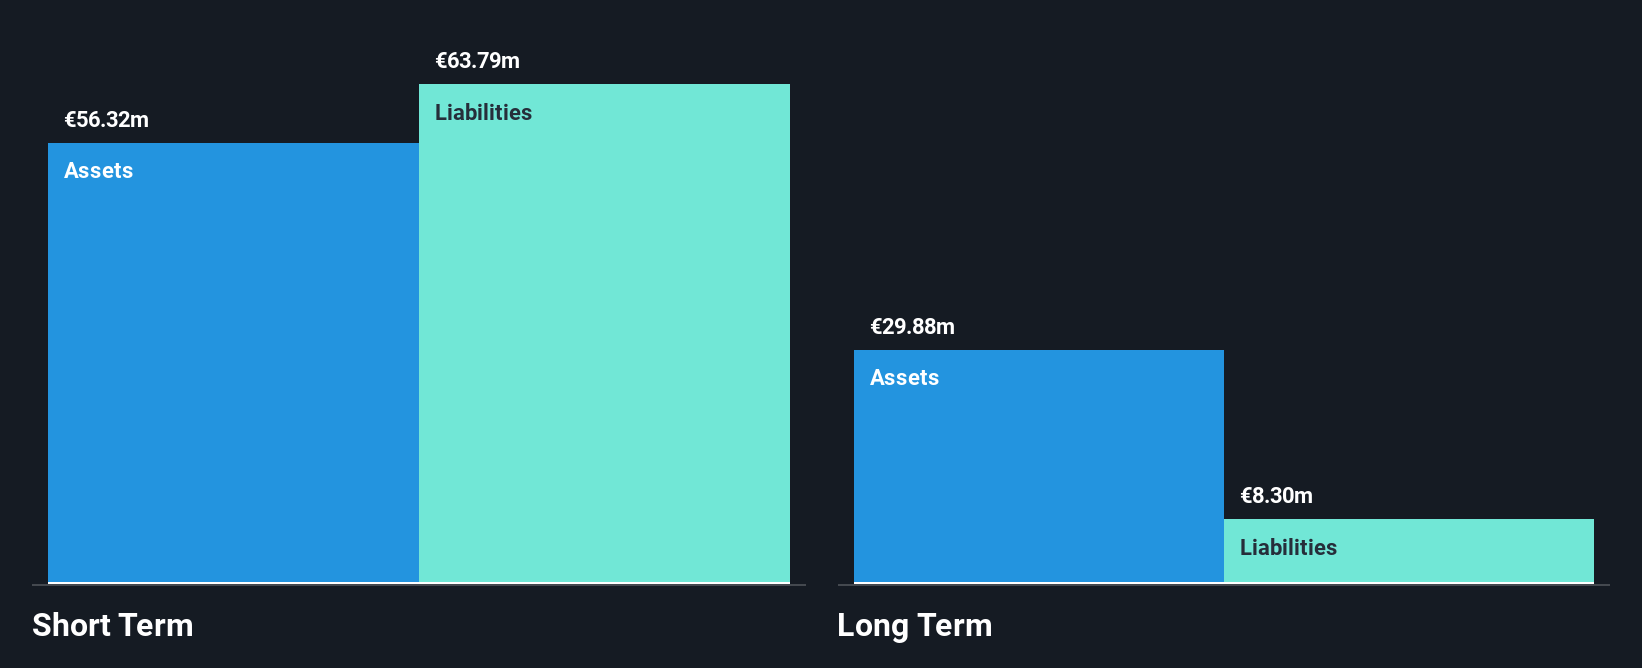
Olidata S.p.A., with a market cap of €43.55 million, faces challenges typical of penny stocks. The company's recent earnings report for the first half of 2025 shows a decline in revenue to €33.17 million from €57.54 million the previous year, alongside a net loss of €0.495 million compared to a net income previously reported. Despite this downturn, Olidata has more cash than total debt and its interest payments are well covered by EBIT at 154.1x coverage, indicating financial stability in some areas. However, short-term liabilities exceed short-term assets and negative earnings growth presents ongoing concerns for investors.
- Dive into the specifics of Olidata here with our thorough balance sheet health report.
- Assess Olidata's future earnings estimates with our detailed growth reports.
Aiforia Technologies Oyj (HLSE:AIFORIA)
Simply Wall St Financial Health Rating: ★★★★☆☆
Overview: Aiforia Technologies Oyj, along with its subsidiary Aiforia Inc., offers AI-based image analysis software for clinical, preclinical, and academic laboratories globally, with a market cap of €83.44 million.
Operations: The company generates revenue of €2.88 million from its healthcare software segment.
Market Cap: €83.44M
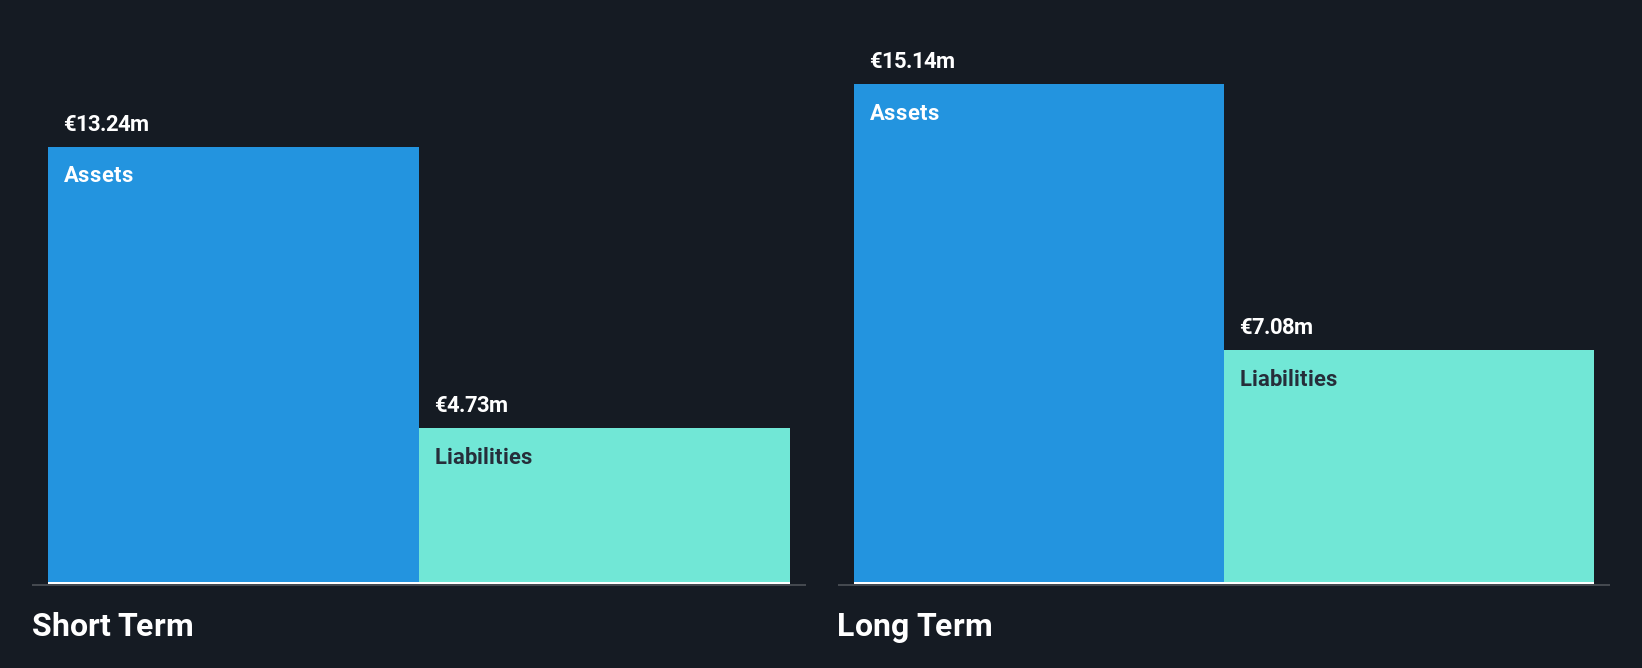
Aiforia Technologies Oyj, with a market cap of €83.44 million, is navigating the complex landscape of penny stocks by leveraging strategic partnerships and AI-driven solutions in pathology diagnostics. Recent collaborations with Siemens Healthineers and Institut Curie highlight its efforts to expand its market presence across Europe. Despite generating €2.88 million in revenue, Aiforia remains unprofitable with increasing losses over the past five years and a cash runway of less than a year if current trends continue. However, it maintains more cash than total debt and has reduced its debt-to-equity ratio significantly over time.
- Unlock comprehensive insights into our analysis of Aiforia Technologies Oyj stock in this financial health report.
- Explore Aiforia Technologies Oyj's analyst forecasts in our growth report.
Hunter Group (OB:HUNT)
Simply Wall St Financial Health Rating: ★★★★★★
Overview: Hunter Group ASA offers oil tanker chartering services through Very Large Crude Carriers (VLCCs) in Norway, with a market cap of NOK 210.87 million.
Operations: The company generates revenue from developing and operating Very Large Crude Carriers (VLCCs), with a reported segment revenue of -$9.53 million.
Market Cap: NOK210.87M
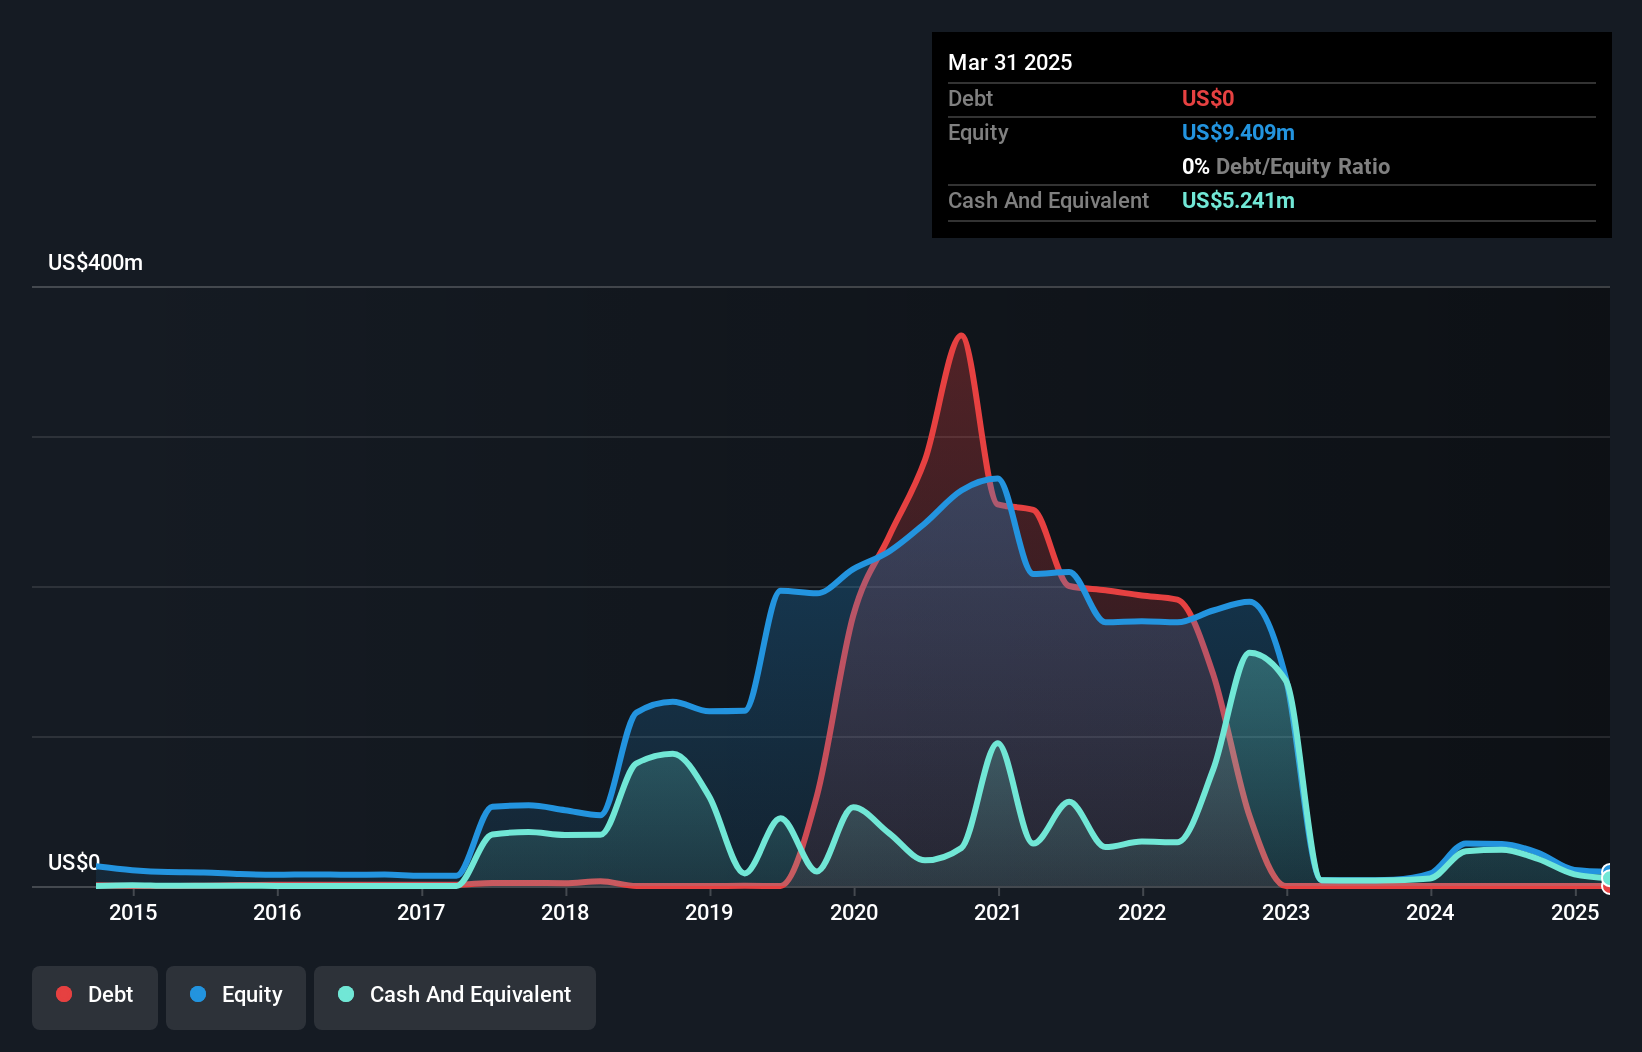
Hunter Group ASA, with a market cap of NOK 210.87 million, operates in the oil tanker sector through Very Large Crude Carriers (VLCCs). Despite recent earnings improvements, reporting USD 3.98 million in revenue for Q2 2025 and a net income of USD 3.57 million, the company remains highly volatile with significant insider selling noted recently. Its management is seasoned with an average tenure of 7.5 years, though its board is relatively new at 2.7 years on average. Hunter Group is debt-free and its short-term assets comfortably exceed liabilities, but it faces challenges from past unprofitability and fluctuating revenues.
- Navigate through the intricacies of Hunter Group with our comprehensive balance sheet health report here.
- Learn about Hunter Group's historical performance here.
Seize The Opportunity
- Click here to access our complete index of 278 European Penny Stocks.
- Curious About Other Options? These 15 companies survived and thrived after COVID and have the right ingredients to survive Trump's tariffs. Discover why before your portfolio feels the trade war pinch.
This article by Simply Wall St is general in nature. We provide commentary based on historical data and analyst forecasts only using an unbiased methodology and our articles are not intended to be financial advice. It does not constitute a recommendation to buy or sell any stock, and does not take account of your objectives, or your financial situation. We aim to bring you long-term focused analysis driven by fundamental data. Note that our analysis may not factor in the latest price-sensitive company announcements or qualitative material. Simply Wall St has no position in any stocks mentioned.
Valuation is complex, but we're here to simplify it.
Discover if Hunter Group might be undervalued or overvalued with our detailed analysis, featuring fair value estimates, potential risks, dividends, insider trades, and its financial condition.
Access Free AnalysisHave feedback on this article? Concerned about the content? Get in touch with us directly. Alternatively, email editorial-team@simplywallst.com
About OB:HUNT
Hunter Group
Provides oil tanker chartering services through VLCCs in Norway.
Flawless balance sheet with moderate risk.
Market Insights

Advertisement
Community Narratives
MINISO's fair value is projected at 26.69 with an anticipated PE ratio shift of 20x
Fair Value US$24.03|11.4% undervalued
BE
Community Contributor
Procter & Gamble: A Dividend Giant Facing Slowing Growth
Fair Value US$119.81|23.5% overvalued
AN
Community Contributor
Eli Lilly's Future Growth Driven by Tirzepatide and Favorable Market Conditions
Fair Value US$1.19k|14.0% undervalued
EA
Community Contributor