
Advertisement
Weak Statutory Earnings May Not Tell The Whole Story For Maps (BIT:MAPS)
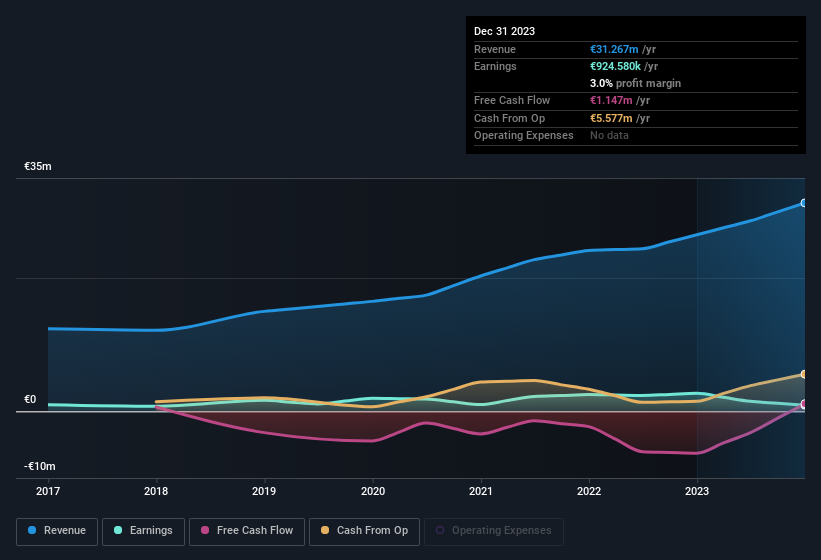
A lackluster earnings announcement from Maps S.p.A. (BIT:MAPS) last week didn't sink the stock price. We think that investors are worried about some weaknesses underlying the earnings.
See our latest analysis for Maps
One essential aspect of assessing earnings quality is to look at how much a company is diluting shareholders. As it happens, Maps issued 6.4% more new shares over the last year. Therefore, each share now receives a smaller portion of profit. Per share metrics like EPS help us understand how much actual shareholders are benefitting from the company's profits, while the net income level gives us a better view of the company's absolute size. Check out Maps' historical EPS growth by clicking on this link.
A Look At The Impact Of Maps' Dilution On Its Earnings Per Share (EPS)
Unfortunately, Maps' profit is down 9.7% per year over three years. So you can see that the dilution has had a bit of an impact on shareholders.
If Maps' EPS can grow over time then that drastically improves the chances of the share price moving in the same direction. But on the other hand, we'd be far less excited to learn profit (but not EPS) was improving. For that reason, you could say that EPS is more important that net income in the long run, assuming the goal is to assess whether a company's share price might grow.
That might leave you wondering what analysts are forecasting in terms of future profitability. Luckily, you can click here to see an interactive graph depicting future profitability, based on their estimates.
Our Take On Maps' Profit Performance
Maps issued shares during the year, and that means its EPS performance lags its net income growth. Because of this, we think that it may be that Maps' statutory profits are better than its underlying earnings power. Of course, we've only just scratched the surface when it comes to analysing its earnings; one could also consider margins, forecast growth, and return on investment, among other factors. Keep in mind, when it comes to analysing a stock it's worth noting the risks involved. Every company has risks, and we've spotted 3 warning signs for Maps you should know about.
Today we've zoomed in on a single data point to better understand the nature of Maps' profit. But there is always more to discover if you are capable of focussing your mind on minutiae. For example, many people consider a high return on equity as an indication of favorable business economics, while others like to 'follow the money' and search out stocks that insiders are buying. While it might take a little research on your behalf, you may find this free collection of companies boasting high return on equity, or this list of stocks that insiders are buying to be useful.
New: Manage All Your Stock Portfolios in One Place
We've created the ultimate portfolio companion for stock investors, and it's free.
• Connect an unlimited number of Portfolios and see your total in one currency
• Be alerted to new Warning Signs or Risks via email or mobile
• Track the Fair Value of your stocks
Have feedback on this article? Concerned about the content? Get in touch with us directly. Alternatively, email editorial-team (at) simplywallst.com.
This article by Simply Wall St is general in nature. We provide commentary based on historical data and analyst forecasts only using an unbiased methodology and our articles are not intended to be financial advice. It does not constitute a recommendation to buy or sell any stock, and does not take account of your objectives, or your financial situation. We aim to bring you long-term focused analysis driven by fundamental data. Note that our analysis may not factor in the latest price-sensitive company announcements or qualitative material. Simply Wall St has no position in any stocks mentioned.
About BIT:MAPS
Maps
A software solution provider, designs and develops technological solutions to support decision-making processes in public and private businesses and organizations.
Flawless balance sheet and undervalued.
Market Insights

Advertisement
Community Narratives
MicroVision will explode future revenue by 380.37% with a vision towards success
Fair Value US$60.00|98.4% undervalued
TH
Community Contributor
The Indispensable Artery for a New North American Economy
Fair Value CA$132.87|1.3% undervalued
TI
Community Contributor