
Advertisement
Warren Buffett famously said, 'Volatility is far from synonymous with risk.' So it seems the smart money knows that debt - which is usually involved in bankruptcies - is a very important factor, when you assess how risky a company is. Importantly, Intercos S.p.A. (BIT:ICOS) does carry debt. But is this debt a concern to shareholders?
What Risk Does Debt Bring?
Debt and other liabilities become risky for a business when it cannot easily fulfill those obligations, either with free cash flow or by raising capital at an attractive price. Ultimately, if the company can't fulfill its legal obligations to repay debt, shareholders could walk away with nothing. However, a more usual (but still expensive) situation is where a company must dilute shareholders at a cheap share price simply to get debt under control. By replacing dilution, though, debt can be an extremely good tool for businesses that need capital to invest in growth at high rates of return. When we think about a company's use of debt, we first look at cash and debt together.
View our latest analysis for Intercos
What Is Intercos's Net Debt?
The chart below, which you can click on for greater detail, shows that Intercos had €258.8m in debt in December 2023; about the same as the year before. On the flip side, it has €152.8m in cash leading to net debt of about €106.0m.
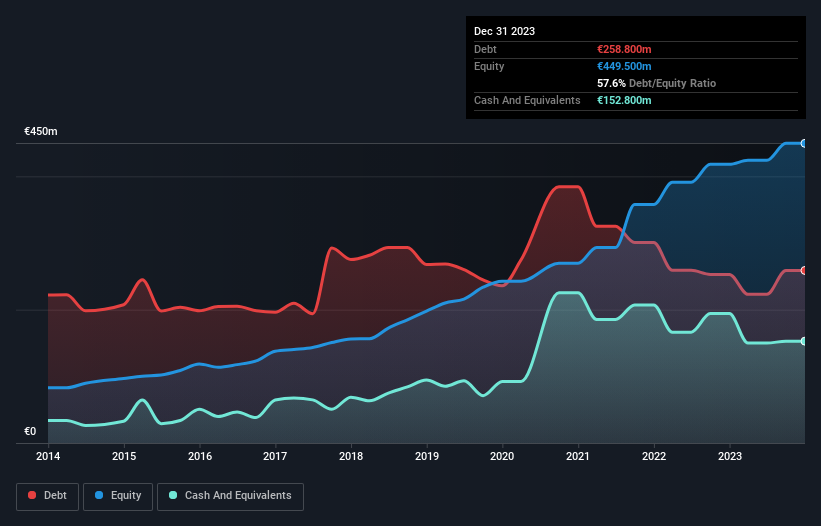
How Healthy Is Intercos' Balance Sheet?
Zooming in on the latest balance sheet data, we can see that Intercos had liabilities of €461.4m due within 12 months and liabilities of €70.0m due beyond that. Offsetting this, it had €152.8m in cash and €167.7m in receivables that were due within 12 months. So it has liabilities totalling €210.9m more than its cash and near-term receivables, combined.
Since publicly traded Intercos shares are worth a total of €1.24b, it seems unlikely that this level of liabilities would be a major threat. But there are sufficient liabilities that we would certainly recommend shareholders continue to monitor the balance sheet, going forward.
In order to size up a company's debt relative to its earnings, we calculate its net debt divided by its earnings before interest, tax, depreciation, and amortization (EBITDA) and its earnings before interest and tax (EBIT) divided by its interest expense (its interest cover). This way, we consider both the absolute quantum of the debt, as well as the interest rates paid on it.
Looking at its net debt to EBITDA of 0.93 and interest cover of 6.5 times, it seems to us that Intercos is probably using debt in a pretty reasonable way. But the interest payments are certainly sufficient to have us thinking about how affordable its debt is. And we also note warmly that Intercos grew its EBIT by 12% last year, making its debt load easier to handle. The balance sheet is clearly the area to focus on when you are analysing debt. But it is future earnings, more than anything, that will determine Intercos's ability to maintain a healthy balance sheet going forward. So if you're focused on the future you can check out this free report showing analyst profit forecasts.
Finally, a business needs free cash flow to pay off debt; accounting profits just don't cut it. So we always check how much of that EBIT is translated into free cash flow. During the last three years, Intercos produced sturdy free cash flow equating to 68% of its EBIT, about what we'd expect. This cold hard cash means it can reduce its debt when it wants to.
Our View
Happily, Intercos's impressive conversion of EBIT to free cash flow implies it has the upper hand on its debt. And that's just the beginning of the good news since its net debt to EBITDA is also very heartening. When we consider the range of factors above, it looks like Intercos is pretty sensible with its use of debt. While that brings some risk, it can also enhance returns for shareholders. Above most other metrics, we think its important to track how fast earnings per share is growing, if at all. If you've also come to that realization, you're in luck, because today you can view this interactive graph of Intercos's earnings per share history for free.
If you're interested in investing in businesses that can grow profits without the burden of debt, then check out this free list of growing businesses that have net cash on the balance sheet.
New: AI Stock Screener & Alerts
Our new AI Stock Screener scans the market every day to uncover opportunities.
• Dividend Powerhouses (3%+ Yield)
• Undervalued Small Caps with Insider Buying
• High growth Tech and AI Companies
Or build your own from over 50 metrics.
Have feedback on this article? Concerned about the content? Get in touch with us directly. Alternatively, email editorial-team (at) simplywallst.com.
This article by Simply Wall St is general in nature. We provide commentary based on historical data and analyst forecasts only using an unbiased methodology and our articles are not intended to be financial advice. It does not constitute a recommendation to buy or sell any stock, and does not take account of your objectives, or your financial situation. We aim to bring you long-term focused analysis driven by fundamental data. Note that our analysis may not factor in the latest price-sensitive company announcements or qualitative material. Simply Wall St has no position in any stocks mentioned.
About BIT:ICOS
Intercos
Intercos S.p.A., together with its subsidiaries, creates, produces, and markets cosmetics and skin care products worldwide.
Flawless balance sheet and good value.
Market Insights

Advertisement
Community Narratives
MicroVision will explode future revenue by 380.37% with a vision towards success
Fair Value US$60.00|98.5% undervalued
TH
Community Contributor
The Indispensable Artery for a New North American Economy
Fair Value CA$132.87|2.3% undervalued
TI
Community Contributor