
Advertisement
Does This Valuation Of Technogym S.p.A. (BIT:TGYM) Imply Investors Are Overpaying?
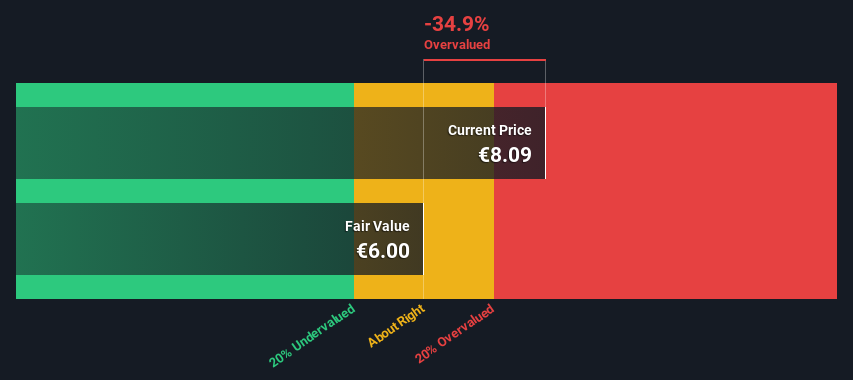
Key Insights
- Technogym's estimated fair value is €6.00 based on 2 Stage Free Cash Flow to Equity
- Current share price of €8.09 suggests Technogym is potentially 35% overvalued
- Analyst price target for TGYM is €8.94, which is 49% above our fair value estimate
Today we'll do a simple run through of a valuation method used to estimate the attractiveness of Technogym S.p.A. (BIT:TGYM) as an investment opportunity by taking the expected future cash flows and discounting them to their present value. Our analysis will employ the Discounted Cash Flow (DCF) model. It may sound complicated, but actually it is quite simple!
We generally believe that a company's value is the present value of all of the cash it will generate in the future. However, a DCF is just one valuation metric among many, and it is not without flaws. Anyone interested in learning a bit more about intrinsic value should have a read of the Simply Wall St analysis model.
Check out our latest analysis for Technogym
The Calculation
We're using the 2-stage growth model, which simply means we take in account two stages of company's growth. In the initial period the company may have a higher growth rate and the second stage is usually assumed to have a stable growth rate. To begin with, we have to get estimates of the next ten years of cash flows. Where possible we use analyst estimates, but when these aren't available we extrapolate the previous free cash flow (FCF) from the last estimate or reported value. We assume companies with shrinking free cash flow will slow their rate of shrinkage, and that companies with growing free cash flow will see their growth rate slow, over this period. We do this to reflect that growth tends to slow more in the early years than it does in later years.
Generally we assume that a dollar today is more valuable than a dollar in the future, and so the sum of these future cash flows is then discounted to today's value:
10-year free cash flow (FCF) forecast
| 2024 | 2025 | 2026 | 2027 | 2028 | 2029 | 2030 | 2031 | 2032 | 2033 | |
| Levered FCF (€, Millions) | €97.6m | €107.6m | €115.1m | €121.4m | €126.9m | €131.7m | €136.0m | €140.0m | €143.8m | €147.5m |
| Growth Rate Estimate Source | Analyst x5 | Analyst x5 | Est @ 6.94% | Est @ 5.50% | Est @ 4.50% | Est @ 3.79% | Est @ 3.30% | Est @ 2.95% | Est @ 2.71% | Est @ 2.54% |
| Present Value (€, Millions) Discounted @ 12% | €87.3 | €86.1 | €82.4 | €77.7 | €72.7 | €67.5 | €62.3 | €57.4 | €52.8 | €48.4 |
("Est" = FCF growth rate estimated by Simply Wall St)
Present Value of 10-year Cash Flow (PVCF) = €695m
The second stage is also known as Terminal Value, this is the business's cash flow after the first stage. The Gordon Growth formula is used to calculate Terminal Value at a future annual growth rate equal to the 5-year average of the 10-year government bond yield of 2.2%. We discount the terminal cash flows to today's value at a cost of equity of 12%.
Terminal Value (TV)= FCF2033 × (1 + g) ÷ (r – g) = €147m× (1 + 2.2%) ÷ (12%– 2.2%) = €1.6b
Present Value of Terminal Value (PVTV)= TV / (1 + r)10= €1.6b÷ ( 1 + 12%)10= €513m
The total value is the sum of cash flows for the next ten years plus the discounted terminal value, which results in the Total Equity Value, which in this case is €1.2b. To get the intrinsic value per share, we divide this by the total number of shares outstanding. Relative to the current share price of €8.1, the company appears reasonably expensive at the time of writing. Remember though, that this is just an approximate valuation, and like any complex formula - garbage in, garbage out.
The Assumptions
Now the most important inputs to a discounted cash flow are the discount rate, and of course, the actual cash flows. You don't have to agree with these inputs, I recommend redoing the calculations yourself and playing with them. The DCF also does not consider the possible cyclicality of an industry, or a company's future capital requirements, so it does not give a full picture of a company's potential performance. Given that we are looking at Technogym as potential shareholders, the cost of equity is used as the discount rate, rather than the cost of capital (or weighted average cost of capital, WACC) which accounts for debt. In this calculation we've used 12%, which is based on a levered beta of 1.157. Beta is a measure of a stock's volatility, compared to the market as a whole. We get our beta from the industry average beta of globally comparable companies, with an imposed limit between 0.8 and 2.0, which is a reasonable range for a stable business.
SWOT Analysis for Technogym
Strength
- Earnings growth over the past year exceeded the industry.
- Debt is not viewed as a risk.
- Dividends are covered by earnings and cash flows.
Weakness
- Dividend is low compared to the top 25% of dividend payers in the Leisure market.
- Expensive based on P/E ratio and estimated fair value.
Opportunity
- Annual earnings are forecast to grow faster than the Italian market.
Threat
- Revenue is forecast to grow slower than 20% per year.
Next Steps:
Although the valuation of a company is important, it is only one of many factors that you need to assess for a company. It's not possible to obtain a foolproof valuation with a DCF model. Preferably you'd apply different cases and assumptions and see how they would impact the company's valuation. For instance, if the terminal value growth rate is adjusted slightly, it can dramatically alter the overall result. Can we work out why the company is trading at a premium to intrinsic value? For Technogym, we've compiled three fundamental elements you should further examine:
- Risks: Consider for instance, the ever-present spectre of investment risk. We've identified 1 warning sign with Technogym , and understanding it should be part of your investment process.
- Future Earnings: How does TGYM's growth rate compare to its peers and the wider market? Dig deeper into the analyst consensus number for the upcoming years by interacting with our free analyst growth expectation chart.
- Other Solid Businesses: Low debt, high returns on equity and good past performance are fundamental to a strong business. Why not explore our interactive list of stocks with solid business fundamentals to see if there are other companies you may not have considered!
PS. Simply Wall St updates its DCF calculation for every Italian stock every day, so if you want to find the intrinsic value of any other stock just search here.
Valuation is complex, but we're here to simplify it.
Discover if Technogym might be undervalued or overvalued with our detailed analysis, featuring fair value estimates, potential risks, dividends, insider trades, and its financial condition.
Access Free AnalysisHave feedback on this article? Concerned about the content? Get in touch with us directly. Alternatively, email editorial-team (at) simplywallst.com.
This article by Simply Wall St is general in nature. We provide commentary based on historical data and analyst forecasts only using an unbiased methodology and our articles are not intended to be financial advice. It does not constitute a recommendation to buy or sell any stock, and does not take account of your objectives, or your financial situation. We aim to bring you long-term focused analysis driven by fundamental data. Note that our analysis may not factor in the latest price-sensitive company announcements or qualitative material. Simply Wall St has no position in any stocks mentioned.
About BIT:TGYM
Technogym
A wellness company, designs, manufactures, and sells fitness equipment in Italy, Rest of Europe, the United States, Asia-Pacific, and the Middle East.
Outstanding track record with flawless balance sheet.
Similar Companies
Market Insights

Advertisement
Community Narratives
MicroVision will explode future revenue by 380.37% with a vision towards success
Fair Value US$60.00|98.4% undervalued
TH
Community Contributor
The Indispensable Artery for a New North American Economy
Fair Value CA$132.87|1.3% undervalued
TI
Community Contributor