
Advertisement
Salvatore Ferragamo S.p.A. (BIT:SFER) Stock's On A Decline: Are Poor Fundamentals The Cause?

With its stock down 29% over the past three months, it is easy to disregard Salvatore Ferragamo (BIT:SFER). We decided to study the company's financials to determine if the downtrend will continue as the long-term performance of a company usually dictates market outcomes. Particularly, we will be paying attention to Salvatore Ferragamo's ROE today.
Return on equity or ROE is a key measure used to assess how efficiently a company's management is utilizing the company's capital. In other words, it is a profitability ratio which measures the rate of return on the capital provided by the company's shareholders.
See our latest analysis for Salvatore Ferragamo
How Is ROE Calculated?
Return on equity can be calculated by using the formula:
Return on Equity = Net Profit (from continuing operations) ÷ Shareholders' Equity
So, based on the above formula, the ROE for Salvatore Ferragamo is:
3.6% = €26m ÷ €722m (Based on the trailing twelve months to December 2023).
The 'return' is the amount earned after tax over the last twelve months. So, this means that for every €1 of its shareholder's investments, the company generates a profit of €0.04.
Why Is ROE Important For Earnings Growth?
So far, we've learned that ROE is a measure of a company's profitability. Depending on how much of these profits the company reinvests or "retains", and how effectively it does so, we are then able to assess a company’s earnings growth potential. Assuming everything else remains unchanged, the higher the ROE and profit retention, the higher the growth rate of a company compared to companies that don't necessarily bear these characteristics.
Salvatore Ferragamo's Earnings Growth And 3.6% ROE
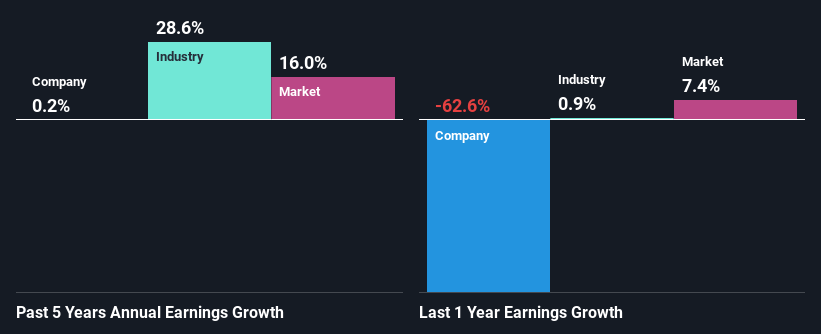
It is quite clear that Salvatore Ferragamo's ROE is rather low. Even when compared to the industry average of 14%, the ROE figure is pretty disappointing. Hence, the flat earnings seen by Salvatore Ferragamo over the past five years could probably be the result of it having a lower ROE.
As a next step, we compared Salvatore Ferragamo's net income growth with the industry and were disappointed to see that the company's growth is lower than the industry average growth of 29% in the same period.
Earnings growth is a huge factor in stock valuation. It’s important for an investor to know whether the market has priced in the company's expected earnings growth (or decline). Doing so will help them establish if the stock's future looks promising or ominous. What is SFER worth today? The intrinsic value infographic in our free research report helps visualize whether SFER is currently mispriced by the market.
Is Salvatore Ferragamo Making Efficient Use Of Its Profits?
The high three-year median payout ratio of 67% (meaning, the company retains only 33% of profits) for Salvatore Ferragamo suggests that the company's earnings growth was miniscule as a result of paying out a majority of its earnings.
In addition, Salvatore Ferragamo has been paying dividends over a period of at least ten years suggesting that keeping up dividend payments is way more important to the management even if it comes at the cost of business growth. Our latest analyst data shows that the future payout ratio of the company over the next three years is expected to be approximately 57%. Still, forecasts suggest that Salvatore Ferragamo's future ROE will rise to 7.1% even though the the company's payout ratio is not expected to change by much.
Summary
Overall, we would be extremely cautious before making any decision on Salvatore Ferragamo. As a result of its low ROE and lack of much reinvestment into the business, the company has seen a disappointing earnings growth rate. With that said, the latest industry analyst forecasts reveal that the company's earnings are expected to accelerate. To know more about the company's future earnings growth forecasts take a look at this free report on analyst forecasts for the company to find out more.
New: Manage All Your Stock Portfolios in One Place
We've created the ultimate portfolio companion for stock investors, and it's free.
• Connect an unlimited number of Portfolios and see your total in one currency
• Be alerted to new Warning Signs or Risks via email or mobile
• Track the Fair Value of your stocks
Have feedback on this article? Concerned about the content? Get in touch with us directly. Alternatively, email editorial-team (at) simplywallst.com.
This article by Simply Wall St is general in nature. We provide commentary based on historical data and analyst forecasts only using an unbiased methodology and our articles are not intended to be financial advice. It does not constitute a recommendation to buy or sell any stock, and does not take account of your objectives, or your financial situation. We aim to bring you long-term focused analysis driven by fundamental data. Note that our analysis may not factor in the latest price-sensitive company announcements or qualitative material. Simply Wall St has no position in any stocks mentioned.
Have feedback on this article? Concerned about the content? Get in touch with us directly. Alternatively, email editorial-team@simplywallst.com
About BIT:SFER
Salvatore Ferragamo
Through its subsidiaries, creates, produces, and sells luxury goods for men and women in Europe, North America, Japan, the Asia Pacific, and Central and South America.
Adequate balance sheet and fair value.
Similar Companies
Market Insights


Advertisement
Community Narratives
MicroStrategy: Volatile Gamble or Golden Opportunity?
Fair Value US$663.00|31.2% undervalued
BL
Community Contributor
Emerging Markets and Debt Reduction Will Propel Bath & Body Works Forward
Fair Value US$40.73|24.4% undervalued
ZW
Community Contributor
An amazing opportunity to potentially get a 100 bagger
Fair Value US$10.00|13.5% overvalued
DA
Community Contributor