Advertisement
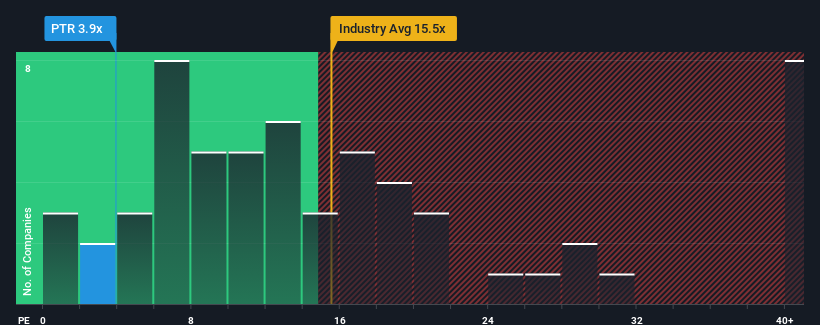
With a price-to-earnings (or "P/E") ratio of 3.9x Pattern S.p.A. (BIT:PTR) may be sending very bullish signals at the moment, given that almost half of all companies in Italy have P/E ratios greater than 15x and even P/E's higher than 26x are not unusual. Although, it's not wise to just take the P/E at face value as there may be an explanation why it's so limited.
As an illustration, earnings have deteriorated at Pattern over the last year, which is not ideal at all. It might be that many expect the disappointing earnings performance to continue or accelerate, which has repressed the P/E. However, if this doesn't eventuate then existing shareholders may be feeling optimistic about the future direction of the share price.
Check out our latest analysis for Pattern
Is There Any Growth For Pattern?
The only time you'd be truly comfortable seeing a P/E as depressed as Pattern's is when the company's growth is on track to lag the market decidedly.
Taking a look back first, the company's earnings per share growth last year wasn't something to get excited about as it posted a disappointing decline of 37%. Even so, admirably EPS has lifted 884% in aggregate from three years ago, notwithstanding the last 12 months. So we can start by confirming that the company has generally done a very good job of growing earnings over that time, even though it had some hiccups along the way.
Weighing that recent medium-term earnings trajectory against the broader market's one-year forecast for expansion of 19% shows it's noticeably more attractive on an annualised basis.
With this information, we find it odd that Pattern is trading at a P/E lower than the market. It looks like most investors are not convinced the company can maintain its recent growth rates.
The Final Word
Typically, we'd caution against reading too much into price-to-earnings ratios when settling on investment decisions, though it can reveal plenty about what other market participants think about the company.
Our examination of Pattern revealed its three-year earnings trends aren't contributing to its P/E anywhere near as much as we would have predicted, given they look better than current market expectations. There could be some major unobserved threats to earnings preventing the P/E ratio from matching this positive performance. It appears many are indeed anticipating earnings instability, because the persistence of these recent medium-term conditions would normally provide a boost to the share price.
It is also worth noting that we have found 2 warning signs for Pattern (1 can't be ignored!) that you need to take into consideration.
You might be able to find a better investment than Pattern. If you want a selection of possible candidates, check out this free list of interesting companies that trade on a low P/E (but have proven they can grow earnings).
New: Manage All Your Stock Portfolios in One Place
We've created the ultimate portfolio companion for stock investors, and it's free.
• Connect an unlimited number of Portfolios and see your total in one currency
• Be alerted to new Warning Signs or Risks via email or mobile
• Track the Fair Value of your stocks
Have feedback on this article? Concerned about the content? Get in touch with us directly. Alternatively, email editorial-team (at) simplywallst.com.
This article by Simply Wall St is general in nature. We provide commentary based on historical data and analyst forecasts only using an unbiased methodology and our articles are not intended to be financial advice. It does not constitute a recommendation to buy or sell any stock, and does not take account of your objectives, or your financial situation. We aim to bring you long-term focused analysis driven by fundamental data. Note that our analysis may not factor in the latest price-sensitive company announcements or qualitative material. Simply Wall St has no position in any stocks mentioned.
About BIT:PTR
Pattern
Engages in engineering, prototyping, and production of luxury goods in Italy, rest of the European Union, and internationally.
Very undervalued with moderate growth potential.
Market Insights


Advertisement
Weekly Picks
LO


Lou_Basenese on Virtuix Holdings ·
From a “Shark Tank” Snub to an Air Force “Yes”: Why Virtuix at $3.50 May Be the Market’s Most Mispriced AI Story
Fair Value:US$7.562.8% undervalued
19 followersusers have followed this narrative
0 commentsusers have commented on this narrative
2 likesusers have liked this narrative
IN


Investingwilly on Mastercard ·
Mastercard: The Best Dividend Stock You're Ignoring
Fair Value:US$75033.5% undervalued
66 followersusers have followed this narrative
1 commentusers have commented on this narrative
8 likesusers have liked this narrative
TR


tripledub on Intuit ·
A Wonderful Business at a Not-So-Wonderful Price
Fair Value:US$56052.2% undervalued
63 followersusers have followed this narrative
4 commentsusers have commented on this narrative
29 likesusers have liked this narrative
TA


Talos on MindWalk Holdings ·
The Asymmetric TechBio Play: MindWalk Holdings and the Valuation Disconnect
Fair Value:US$8.2780.9% undervalued
35 followersusers have followed this narrative
0 commentsusers have commented on this narrative
9 likesusers have liked this narrative
Recently Updated Narratives
RO


RockeTeller on NeXGold Mining ·
NexGold Mining: 4.7Moz M&I Resources, $100M Cash + Debt-Free, Construction Decision 2026 Undervalued Canadian Gold Developer
Fair Value:CA$39.5296.9% undervalued
4 followersusers have followed this narrative
3 commentsusers have commented on this narrative
0 likesusers have liked this narrative
FA


Faltaren on AmpliTech Group ·
AmpliTech Group Will Triple Revenue by 2030 with O-RAN Expansion
Fair Value:US$3078.2% undervalued
1 followerusers have followed this narrative
0 commentsusers have commented on this narrative
0 likesusers have liked this narrative
AS


AstrisCorporateAdvisory on Polaris Holdings ·
Share gains to fuel earnings momentum
Fair Value:JP¥211.166.7% undervalued
2 followersusers have followed this narrative
0 commentsusers have commented on this narrative
0 likesusers have liked this narrative
Popular Narratives
HA


HarishPK on Adobe ·
Adobe: A Probabilistic Case for Undervaluation
Fair Value:US$319.9636.6% undervalued
61 followersusers have followed this narrative
9 commentsusers have commented on this narrative
19 likesusers have liked this narrative
MA


martinarauz on Nu Holdings ·
Investment Analysis (May 2026)
Fair Value:US$22.7442.1% undervalued
68 followersusers have followed this narrative
0 commentsusers have commented on this narrative
17 likesusers have liked this narrative
IN
Investingwilly on Mastercard ·
Mastercard: The Best Dividend Stock You're Ignoring
Fair Value:US$75033.5% undervalued
66 followersusers have followed this narrative
1 commentusers have commented on this narrative
8 likesusers have liked this narrative
