
Advertisement
If you're looking at a mature business that's past the growth phase, what are some of the underlying trends that pop up? When we see a declining return on capital employed (ROCE) in conjunction with a declining base of capital employed, that's often how a mature business shows signs of aging. Trends like this ultimately mean the business is reducing its investments and also earning less on what it has invested. On that note, looking into Giorgio Fedon & Figli (BIT:FED), we weren't too upbeat about how things were going.
What is Return On Capital Employed (ROCE)?
Just to clarify if you're unsure, ROCE is a metric for evaluating how much pre-tax income (in percentage terms) a company earns on the capital invested in its business. The formula for this calculation on Giorgio Fedon & Figli is:
Return on Capital Employed = Earnings Before Interest and Tax (EBIT) ÷ (Total Assets - Current Liabilities)
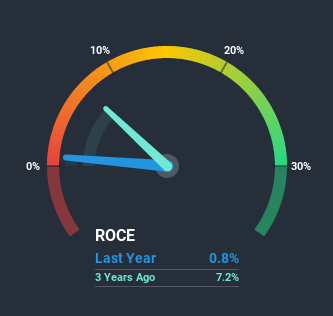
0.008 = €251k ÷ (€54m - €22m) (Based on the trailing twelve months to June 2020).
Therefore, Giorgio Fedon & Figli has an ROCE of 0.8%. Ultimately, that's a low return and it under-performs the Luxury industry average of 6.4%.
View our latest analysis for Giorgio Fedon & Figli
While the past is not representative of the future, it can be helpful to know how a company has performed historically, which is why we have this chart above. If you want to delve into the historical earnings, revenue and cash flow of Giorgio Fedon & Figli, check out these free graphs here.
So How Is Giorgio Fedon & Figli's ROCE Trending?
In terms of Giorgio Fedon & Figli's historical ROCE movements, the trend doesn't inspire confidence. Unfortunately the returns on capital have diminished from the 7.6% that they were earning five years ago. And on the capital employed front, the business is utilizing roughly the same amount of capital as it was back then. Since returns are falling and the business has the same amount of assets employed, this can suggest it's a mature business that hasn't had much growth in the last five years. If these trends continue, we wouldn't expect Giorgio Fedon & Figli to turn into a multi-bagger.
On a side note, Giorgio Fedon & Figli's current liabilities are still rather high at 41% of total assets. This can bring about some risks because the company is basically operating with a rather large reliance on its suppliers or other sorts of short-term creditors. Ideally we'd like to see this reduce as that would mean fewer obligations bearing risks.
The Bottom Line
All in all, the lower returns from the same amount of capital employed aren't exactly signs of a compounding machine. Investors haven't taken kindly to these developments, since the stock has declined 66% from where it was five years ago. With underlying trends that aren't great in these areas, we'd consider looking elsewhere.
If you'd like to know more about Giorgio Fedon & Figli, we've spotted 2 warning signs, and 1 of them is potentially serious.
While Giorgio Fedon & Figli may not currently earn the highest returns, we've compiled a list of companies that currently earn more than 25% return on equity. Check out this free list here.
If you decide to trade Giorgio Fedon & Figli, use the lowest-cost* platform that is rated #1 Overall by Barron’s, Interactive Brokers. Trade stocks, options, futures, forex, bonds and funds on 135 markets, all from a single integrated account. Promoted
New: Manage All Your Stock Portfolios in One Place
We've created the ultimate portfolio companion for stock investors, and it's free.
• Connect an unlimited number of Portfolios and see your total in one currency
• Be alerted to new Warning Signs or Risks via email or mobile
• Track the Fair Value of your stocks
This article by Simply Wall St is general in nature. It does not constitute a recommendation to buy or sell any stock, and does not take account of your objectives, or your financial situation. We aim to bring you long-term focused analysis driven by fundamental data. Note that our analysis may not factor in the latest price-sensitive company announcements or qualitative material. Simply Wall St has no position in any stocks mentioned.
*Interactive Brokers Rated Lowest Cost Broker by StockBrokers.com Annual Online Review 2020
Have feedback on this article? Concerned about the content? Get in touch with us directly. Alternatively, email editorial-team (at) simplywallst.com.
About BIT:FED
Giorgio Fedon & Figli
Giorgio Fedon & Figli Spa produces and markets eyeglass cases, custom and luxury packaging, and leather accessories worldwide.
Adequate balance sheet and overvalued.
Market Insights

Advertisement
Community Narratives
Finding The True Value Of A Logistics Powerhouse
Fair Value US$95.21|8.4% undervalued
NV
Community Contributor
Paradigm Biopharmaceuticals Will Lead Osteoarthritis Treatment with Zilosul's FDA Success
Fair Value AU$5.50|91.9% undervalued
AM
Community Contributor
Barrick Mining (ABX:CA): A Gold Hedge against a U.S. Shutdown
Fair Value CA$60.00|24.2% undervalued
GM
Community Contributor