- Italy
- /
- Construction
- /
- BIT:ESIGM
ESI S.p.A.'s (BIT:ESIGM) Shares Leap 25% Yet They're Still Not Telling The Full Story
ESI S.p.A. (BIT:ESIGM) shareholders have had their patience rewarded with a 25% share price jump in the last month. Unfortunately, the gains of the last month did little to right the losses of the last year with the stock still down 16% over that time.
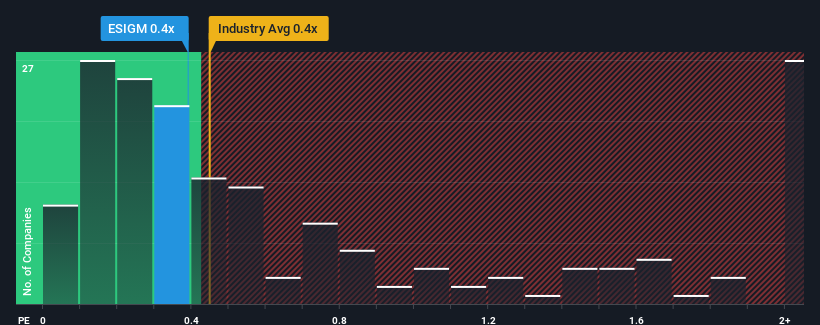
In spite of the firm bounce in price, there still wouldn't be many who think ESI's price-to-sales (or "P/S") ratio of 0.4x is worth a mention when the median P/S in Italy's Construction industry is similar at about 0.6x. However, investors might be overlooking a clear opportunity or potential setback if there is no rational basis for the P/S.
See our latest analysis for ESI

What Does ESI's P/S Mean For Shareholders?
Recent times have been advantageous for ESI as its revenues have been rising faster than most other companies. One possibility is that the P/S ratio is moderate because investors think this strong revenue performance might be about to tail off. If you like the company, you'd be hoping this isn't the case so that you could potentially pick up some stock while it's not quite in favour.
Keen to find out how analysts think ESI's future stacks up against the industry? In that case, our free report is a great place to start.How Is ESI's Revenue Growth Trending?
In order to justify its P/S ratio, ESI would need to produce growth that's similar to the industry.
Retrospectively, the last year delivered an exceptional 131% gain to the company's top line. Pleasingly, revenue has also lifted 147% in aggregate from three years ago, thanks to the last 12 months of growth. So we can start by confirming that the company has done a great job of growing revenue over that time.
Shifting to the future, estimates from the sole analyst covering the company suggest revenue should grow by 29% per annum over the next three years. That's shaping up to be materially higher than the 17% each year growth forecast for the broader industry.
In light of this, it's curious that ESI's P/S sits in line with the majority of other companies. It may be that most investors aren't convinced the company can achieve future growth expectations.
What We Can Learn From ESI's P/S?
ESI's stock has a lot of momentum behind it lately, which has brought its P/S level with the rest of the industry. While the price-to-sales ratio shouldn't be the defining factor in whether you buy a stock or not, it's quite a capable barometer of revenue expectations.
We've established that ESI currently trades on a lower than expected P/S since its forecasted revenue growth is higher than the wider industry. Perhaps uncertainty in the revenue forecasts are what's keeping the P/S ratio consistent with the rest of the industry. This uncertainty seems to be reflected in the share price which, while stable, could be higher given the revenue forecasts.
It is also worth noting that we have found 2 warning signs for ESI (1 makes us a bit uncomfortable!) that you need to take into consideration.
It's important to make sure you look for a great company, not just the first idea you come across. So if growing profitability aligns with your idea of a great company, take a peek at this free list of interesting companies with strong recent earnings growth (and a low P/E).
Valuation is complex, but we're here to simplify it.
Discover if ESI might be undervalued or overvalued with our detailed analysis, featuring fair value estimates, potential risks, dividends, insider trades, and its financial condition.
Access Free AnalysisHave feedback on this article? Concerned about the content? Get in touch with us directly. Alternatively, email editorial-team (at) simplywallst.com.
This article by Simply Wall St is general in nature. We provide commentary based on historical data and analyst forecasts only using an unbiased methodology and our articles are not intended to be financial advice. It does not constitute a recommendation to buy or sell any stock, and does not take account of your objectives, or your financial situation. We aim to bring you long-term focused analysis driven by fundamental data. Note that our analysis may not factor in the latest price-sensitive company announcements or qualitative material. Simply Wall St has no position in any stocks mentioned.
About BIT:ESIGM
High growth potential with excellent balance sheet.
Market Insights
Community Narratives


