
Advertisement
- India
- /
- Renewable Energy
- /
- NSEI:RTNPOWER
Many Still Looking Away From RattanIndia Power Limited (NSE:RTNPOWER)
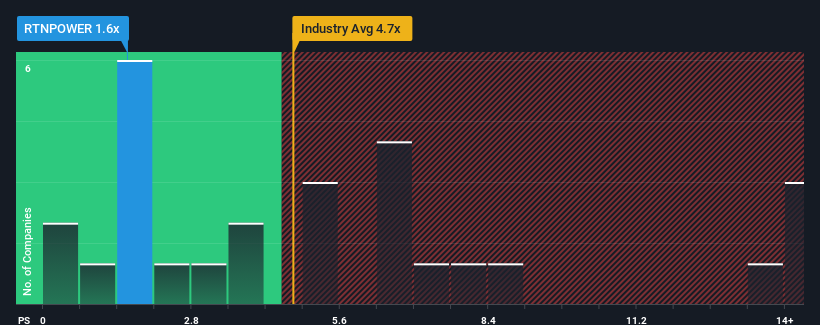
When you see that almost half of the companies in the Renewable Energy industry in India have price-to-sales ratios (or "P/S") above 4.7x, RattanIndia Power Limited (NSE:RTNPOWER) looks to be giving off very strong buy signals with its 1.6x P/S ratio. Although, it's not wise to just take the P/S at face value as there may be an explanation why it's so limited.
Check out our latest analysis for RattanIndia Power
How Has RattanIndia Power Performed Recently?
The revenue growth achieved at RattanIndia Power over the last year would be more than acceptable for most companies. Perhaps the market is expecting this acceptable revenue performance to take a dive, which has kept the P/S suppressed. If you like the company, you'd be hoping this isn't the case so that you could potentially pick up some stock while it's out of favour.
Although there are no analyst estimates available for RattanIndia Power, take a look at this free data-rich visualisation to see how the company stacks up on earnings, revenue and cash flow.What Are Revenue Growth Metrics Telling Us About The Low P/S?
The only time you'd be truly comfortable seeing a P/S as depressed as RattanIndia Power's is when the company's growth is on track to lag the industry decidedly.
Retrospectively, the last year delivered a decent 9.2% gain to the company's revenues. This was backed up an excellent period prior to see revenue up by 220% in total over the last three years. Therefore, it's fair to say the revenue growth recently has been superb for the company.
This is in contrast to the rest of the industry, which is expected to grow by 13% over the next year, materially lower than the company's recent medium-term annualised growth rates.
In light of this, it's peculiar that RattanIndia Power's P/S sits below the majority of other companies. Apparently some shareholders believe the recent performance has exceeded its limits and have been accepting significantly lower selling prices.
What Does RattanIndia Power's P/S Mean For Investors?
Using the price-to-sales ratio alone to determine if you should sell your stock isn't sensible, however it can be a practical guide to the company's future prospects.
Our examination of RattanIndia Power revealed its three-year revenue trends aren't boosting its P/S anywhere near as much as we would have predicted, given they look better than current industry expectations. Potential investors that are sceptical over continued revenue performance may be preventing the P/S ratio from matching previous strong performance. At least price risks look to be very low if recent medium-term revenue trends continue, but investors seem to think future revenue could see a lot of volatility.
Don't forget that there may be other risks. For instance, we've identified 2 warning signs for RattanIndia Power that you should be aware of.
If you're unsure about the strength of RattanIndia Power's business, why not explore our interactive list of stocks with solid business fundamentals for some other companies you may have missed.
New: AI Stock Screener & Alerts
Our new AI Stock Screener scans the market every day to uncover opportunities.
• Dividend Powerhouses (3%+ Yield)
• Undervalued Small Caps with Insider Buying
• High growth Tech and AI Companies
Or build your own from over 50 metrics.
Have feedback on this article? Concerned about the content? Get in touch with us directly. Alternatively, email editorial-team (at) simplywallst.com.
This article by Simply Wall St is general in nature. We provide commentary based on historical data and analyst forecasts only using an unbiased methodology and our articles are not intended to be financial advice. It does not constitute a recommendation to buy or sell any stock, and does not take account of your objectives, or your financial situation. We aim to bring you long-term focused analysis driven by fundamental data. Note that our analysis may not factor in the latest price-sensitive company announcements or qualitative material. Simply Wall St has no position in any stocks mentioned.
About NSEI:RTNPOWER
RattanIndia Power
Together with its subsidiary, Poena Power Development Limited, engages in power generation, distribution, trading and transmission, and other ancillary and incidental activities in India.
Questionable track record with imperfect balance sheet.
Market Insights

Advertisement
Community Narratives
MicroVision will explode future revenue by 380.37% with a vision towards success
Fair Value US$60.00|98.4% undervalued
TH
Community Contributor
The Indispensable Artery for a New North American Economy
Fair Value CA$132.87|1.3% undervalued
TI
Community Contributor