- India
- /
- Electric Utilities
- /
- NSEI:ENERGYDEV
Has Energy Development (NSE:ENERGYDEV) Got What It Takes To Become A Multi-Bagger?

Did you know there are some financial metrics that can provide clues of a potential multi-bagger? Amongst other things, we'll want to see two things; firstly, a growing return on capital employed (ROCE) and secondly, an expansion in the company's amount of capital employed. This shows us that it's a compounding machine, able to continually reinvest its earnings back into the business and generate higher returns. Having said that, from a first glance at Energy Development (NSE:ENERGYDEV) we aren't jumping out of our chairs at how returns are trending, but let's have a deeper look.
Understanding Return On Capital Employed (ROCE)
For those who don't know, ROCE is a measure of a company's yearly pre-tax profit (its return), relative to the capital employed in the business. The formula for this calculation on Energy Development is:
Return on Capital Employed = Earnings Before Interest and Tax (EBIT) ÷ (Total Assets - Current Liabilities)
0.022 = ₹54m ÷ (₹3.5b - ₹983m) (Based on the trailing twelve months to September 2020).
Thus, Energy Development has an ROCE of 2.2%. In absolute terms, that's a low return and it also under-performs the Electric Utilities industry average of 7.3%.
See our latest analysis for Energy Development
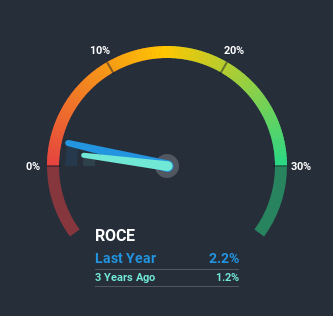
Historical performance is a great place to start when researching a stock so above you can see the gauge for Energy Development's ROCE against it's prior returns. If you're interested in investigating Energy Development's past further, check out this free graph of past earnings, revenue and cash flow.
What Does the ROCE Trend For Energy Development Tell Us?
We're a bit concerned with the trends, because the business is applying 44% less capital than it was five years ago and returns on that capital have stayed flat. When a company effectively decreases its assets base, it's not usually a sign to be optimistic on that company. Not only that, but the low returns on this capital mentioned earlier would leave most investors unimpressed.
On another note, while the change in ROCE trend might not scream for attention, it's interesting that the current liabilities have actually gone up over the last five years. This is intriguing because if current liabilities hadn't increased to 28% of total assets, this reported ROCE would probably be less than2.2% because total capital employed would be higher.The 2.2% ROCE could be even lower if current liabilities weren't 28% of total assets, because the the formula would show a larger base of total capital employed. So while current liabilities isn't high right now, keep an eye out in case it increases further, because this can introduce some elements of risk.What We Can Learn From Energy Development's ROCE
Overall, we're not ecstatic to see Energy Development reducing the amount of capital it employs in the business. Since the stock has declined 68% over the last five years, investors may not be too optimistic on this trend improving either. In any case, the stock doesn't have these traits of a multi-bagger discussed above, so if that's what you're looking for, we think you'd have more luck elsewhere.
On a final note, we found 5 warning signs for Energy Development (2 can't be ignored) you should be aware of.
While Energy Development isn't earning the highest return, check out this free list of companies that are earning high returns on equity with solid balance sheets.
If you decide to trade Energy Development, use the lowest-cost* platform that is rated #1 Overall by Barron’s, Interactive Brokers. Trade stocks, options, futures, forex, bonds and funds on 135 markets, all from a single integrated account. Promoted
The New Payments ETF Is Live on NASDAQ:
Money is moving to real-time rails, and a newly listed ETF now gives investors direct exposure. Fast settlement. Institutional custody. Simple access.
Explore how this launch could reshape portfolios
Sponsored ContentValuation is complex, but we're here to simplify it.
Discover if Energy Development might be undervalued or overvalued with our detailed analysis, featuring fair value estimates, potential risks, dividends, insider trades, and its financial condition.
Access Free AnalysisThis article by Simply Wall St is general in nature. It does not constitute a recommendation to buy or sell any stock, and does not take account of your objectives, or your financial situation. We aim to bring you long-term focused analysis driven by fundamental data. Note that our analysis may not factor in the latest price-sensitive company announcements or qualitative material. Simply Wall St has no position in any stocks mentioned.
*Interactive Brokers Rated Lowest Cost Broker by StockBrokers.com Annual Online Review 2020
Have feedback on this article? Concerned about the content? Get in touch with us directly. Alternatively, email editorial-team (at) simplywallst.com.
About NSEI:ENERGYDEV
Energy Development
Generates and sells electricity from water and wind to various electricity boards in India.
Slight risk and slightly overvalued.
Market Insights

Weekly Picks

Early mover in a fast growing industry. Likely to experience share price volatility as they scale


A case for CA$31.80 (undiluted), aka 8,616% upside from CA$0.37 (an 86 bagger!).


Moderation and Stabilisation: HOLD: Fair Price based on a 4-year Cycle is $12.08
Recently Updated Narratives

Airbnb Stock: Platform Growth in a World of Saturation and Scrutiny

Adobe Stock: AI-Fueled ARR Growth Pushes Guidance Higher, But Cost Pressures Loom

Thomson Reuters Stock: When Legal Intelligence Becomes Mission-Critical Infrastructure
Popular Narratives


Crazy Undervalued 42 Baggers Silver Play (Active & Running Mine)


NVDA: Expanding AI Demand Will Drive Major Data Center Investments Through 2026

The AI Infrastructure Giant Grows Into Its Valuation
Trending Discussion


