
Advertisement
- India
- /
- Electric Utilities
- /
- NSEI:ENERGYDEV
Energy Development (NSE:ENERGYDEV) Hasn't Managed To Accelerate Its Returns
If we want to find a stock that could multiply over the long term, what are the underlying trends we should look for? In a perfect world, we'd like to see a company investing more capital into its business and ideally the returns earned from that capital are also increasing. Basically this means that a company has profitable initiatives that it can continue to reinvest in, which is a trait of a compounding machine. Having said that, from a first glance at Energy Development (NSE:ENERGYDEV) we aren't jumping out of our chairs at how returns are trending, but let's have a deeper look.
Return On Capital Employed (ROCE): What is it?
For those who don't know, ROCE is a measure of a company's yearly pre-tax profit (its return), relative to the capital employed in the business. Analysts use this formula to calculate it for Energy Development:
Return on Capital Employed = Earnings Before Interest and Tax (EBIT) ÷ (Total Assets - Current Liabilities)
0.022 = ₹54m ÷ (₹3.5b - ₹983m) (Based on the trailing twelve months to September 2020).
Thus, Energy Development has an ROCE of 2.2%. In absolute terms, that's a low return and it also under-performs the Electric Utilities industry average of 7.7%.
See our latest analysis for Energy Development
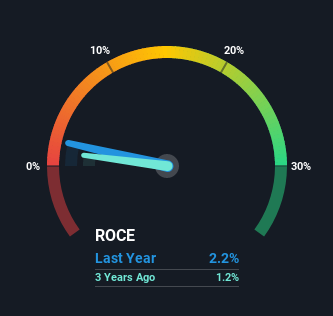
Historical performance is a great place to start when researching a stock so above you can see the gauge for Energy Development's ROCE against it's prior returns. If you're interested in investigating Energy Development's past further, check out this free graph of past earnings, revenue and cash flow.
What The Trend Of ROCE Can Tell Us
We're a bit concerned with the trends, because the business is applying 44% less capital than it was five years ago and returns on that capital have stayed flat. To us that doesn't look like a multi-bagger because the company appears to be selling assets and it's returns aren't increasing. Not only that, but the low returns on this capital mentioned earlier would leave most investors unimpressed.
On another note, while the change in ROCE trend might not scream for attention, it's interesting that the current liabilities have actually gone up over the last five years. This is intriguing because if current liabilities hadn't increased to 28% of total assets, this reported ROCE would probably be less than2.2% because total capital employed would be higher.The 2.2% ROCE could be even lower if current liabilities weren't 28% of total assets, because the the formula would show a larger base of total capital employed. So while current liabilities isn't high right now, keep an eye out in case it increases further, because this can introduce some elements of risk.
In Conclusion...
It's a shame to see that Energy Development is effectively shrinking in terms of its capital base. And investors may be expecting the fundamentals to get a lot worse because the stock has crashed 85% over the last five years. In any case, the stock doesn't have these traits of a multi-bagger discussed above, so if that's what you're looking for, we think you'd have more luck elsewhere.
Since virtually every company faces some risks, it's worth knowing what they are, and we've spotted 5 warning signs for Energy Development (of which 2 are concerning!) that you should know about.
For those who like to invest in solid companies, check out this free list of companies with solid balance sheets and high returns on equity.
When trading Energy Development or any other investment, use the platform considered by many to be the Professional's Gateway to the Worlds Market, Interactive Brokers. You get the lowest-cost* trading on stocks, options, futures, forex, bonds and funds worldwide from a single integrated account. Promoted
Valuation is complex, but we're here to simplify it.
Discover if Energy Development might be undervalued or overvalued with our detailed analysis, featuring fair value estimates, potential risks, dividends, insider trades, and its financial condition.
Access Free AnalysisThis article by Simply Wall St is general in nature. It does not constitute a recommendation to buy or sell any stock, and does not take account of your objectives, or your financial situation. We aim to bring you long-term focused analysis driven by fundamental data. Note that our analysis may not factor in the latest price-sensitive company announcements or qualitative material. Simply Wall St has no position in any stocks mentioned.
*Interactive Brokers Rated Lowest Cost Broker by StockBrokers.com Annual Online Review 2020
Have feedback on this article? Concerned about the content? Get in touch with us directly. Alternatively, email editorial-team (at) simplywallst.com.
MI

The Foxhole
A landmark settlement is meant to punish Meta (META). If the 1998 tobacco deal is any guide, it might protect it.
179
ZO
zoe_vi5fn
Any moat with an opt-out clause for your competitors is just a fence around your own garden.
CO
connor_iwn1g
Worth looking at what previous legal action actually did to Meta rather than reaching for tobacco. The FTC's record five billion dollar privacy fine in 2019 was met with the stock rising, because it came in below fears and removed an open question. GDPR was designed to constrain large platforms and increased their share of the European ad market, because compliance cost fell hardest on small intermediaries. The FTC's antitrust case, the one that could genuinely have broken the company up, was decided in Meta's favour last November. The only thing that ever meaningfully hurt the business was Apple changing a tracking default, and Meta out-spent that too, while the ad-tech firms that could not afford to rebuild disappeared. The pattern is not that Meta survives regulation. It is that regulation keeps costing its smaller competitors more.
 Andrew Legget
Market Insights
Great earnings season, but are the earnings real?

At first glance, this was the strongest earnings season in years. But when you look at where the growth actually came from, the story splits into two very different pictures.
10
About NSEI:ENERGYDEV
Energy Development
Generates and sells electricity from water and wind to various electricity boards in India.
Slight risk and slightly overvalued.
Market Insights


Advertisement
Weekly Picks
LO


Lou_Basenese on Oncolytics Biotech ·
The Team Behind a $2 Billion Johnson & Johnson (JNJ) Deal Just Took Over This $105 Million Cancer Biotech
Fair Value:US$3.575.5% undervalued
31 followersusers have followed this narrative
0 commentsusers have commented on this narrative
8 likesusers have liked this narrative
TR


tripledub on Meta Platforms ·
The $135 Billion Bet That Should Make Every Shareholder Nervous
Fair Value:US$5861.4% undervalued
63 followersusers have followed this narrative
3 commentsusers have commented on this narrative
34 likesusers have liked this narrative
TA


Talos on Voyager Technologies ·
The "Landlord of Orbit" – A Deep Value Play Ahead of the Starlab Era
Fair Value:US$385.291.1% undervalued
65 followersusers have followed this narrative
0 commentsusers have commented on this narrative
6 likesusers have liked this narrative
IV

Ivoed on Uber Technologies ·
Uber’s Valuation Depends On Who Captures The Economics Of Driverless Rides
Fair Value:US$11632.1% undervalued
13 followersusers have followed this narrative
0 commentsusers have commented on this narrative
3 likesusers have liked this narrative
Recently Updated Narratives
JO


John_Eric on Betterware de MéxicoP.I. de ·
Only Two Analysts Cover This Stock.
Fair Value:US$54.6571.1% undervalued
2 followersusers have followed this narrative
1 commentusers have commented on this narrative
0 likesusers have liked this narrative
RO


RockeTeller on Kuya Silver ·
Kuya Silver, The High-Octane Rocket With 15,372 g/t Silver + $12 AISC
Fair Value:CA$10.8493.3% undervalued
10 followersusers have followed this narrative
1 commentusers have commented on this narrative
1 likeusers have liked this narrative
RO


Robbo on Unilever ·
Unilever (LSE:ULVR), changes in the wind.
Fair Value:UK£42.2813.0% overvalued
1 followerusers have followed this narrative
0 commentsusers have commented on this narrative
0 likesusers have liked this narrative
Popular Narratives
OS


oscargarcia on NVIDIA ·
The company that went from selling GPUs to gamers to becoming the AI arms dealer of the 21st century.
Fair Value:US$28022.3% undervalued
363 followersusers have followed this narrative
9 commentsusers have commented on this narrative
16 likesusers have liked this narrative
CU

CubanEros on Microsoft ·
A wonderful business at reasonable price.
Fair Value:US$419.9122.3% overvalued
212 followersusers have followed this narrative
0 commentsusers have commented on this narrative
9 likesusers have liked this narrative
JO

John_Eric on MercadoLibre ·
MercadoLibre and the Spreadsheet Trick That Decides Everything
Fair Value:US$7.31k73.1% undervalued
125 followersusers have followed this narrative
3 commentsusers have commented on this narrative
17 likesusers have liked this narrative
Trending Discussion

BL


Blagget on BP Silver ·
Yes, it is for sure. When I first published my narrative on BP Silver back in January, it gave me strong Santacruz Silver vibes. But now I know this is the next SCZ.I'd like to ask you to take a look at Terra Balcanica (CSE:TERA).I'd be REALLY surprised if it doesn't interest you. I'd even challenge you to find a more undervalued miner than TERA. I'm serious. You'd earn a loyal follower and reader for the rest of my life.Let me point you to three stocks, without further context or explanation of how they're related, to quickly show how unreasonably low Terra Balcanica's market cap is. You'll obviously figure out the connection pretty quickly yourself.Military Metals - license revokedRegener8 Resources - zero-drill neighborAdriatic Metals - neighbor that DPM boughtI promise you, you can dig as deep as you want here, count in every negative aspect and even things that aren't negative but that someone might read as negative, and the current market cap still makes no sense. I strongly believe that will change rather soon though, judging by the level 2 market depth over the last couple of days.I also suggest you take a look at DPM documents/reports regarding Vareš. They seem pleased with the purchase? 😁Anyway, I agree on BP, 100% correct. Enjoyed the read.
0
|0
