- India
- /
- Electric Utilities
- /
- NSEI:ENERGYDEV
Does Energy Development (NSE:ENERGYDEV) Have A Healthy Balance Sheet?

Warren Buffett famously said, 'Volatility is far from synonymous with risk.' So it might be obvious that you need to consider debt, when you think about how risky any given stock is, because too much debt can sink a company. We can see that Energy Development Company Limited (NSE:ENERGYDEV) does use debt in its business. But the more important question is: how much risk is that debt creating?
What Risk Does Debt Bring?
Debt is a tool to help businesses grow, but if a business is incapable of paying off its lenders, then it exists at their mercy. In the worst case scenario, a company can go bankrupt if it cannot pay its creditors. However, a more common (but still painful) scenario is that it has to raise new equity capital at a low price, thus permanently diluting shareholders. Having said that, the most common situation is where a company manages its debt reasonably well - and to its own advantage. When we think about a company's use of debt, we first look at cash and debt together.
What Is Energy Development's Net Debt?
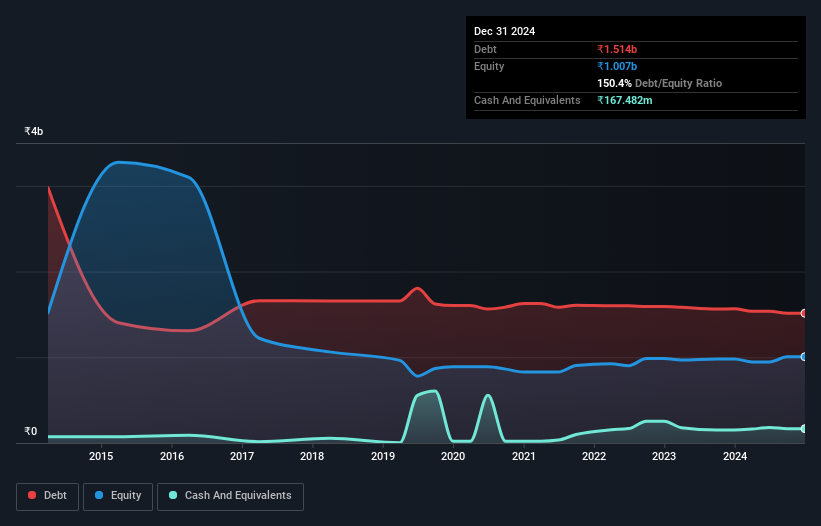
The chart below, which you can click on for greater detail, shows that Energy Development had ₹1.51b in debt in September 2024; about the same as the year before. However, it does have ₹167.5m in cash offsetting this, leading to net debt of about ₹1.35b.
How Healthy Is Energy Development's Balance Sheet?
The latest balance sheet data shows that Energy Development had liabilities of ₹1.63b due within a year, and liabilities of ₹871.8m falling due after that. Offsetting these obligations, it had cash of ₹167.5m as well as receivables valued at ₹525.5m due within 12 months. So its liabilities outweigh the sum of its cash and (near-term) receivables by ₹1.81b.
This deficit casts a shadow over the ₹900.6m company, like a colossus towering over mere mortals. So we'd watch its balance sheet closely, without a doubt. At the end of the day, Energy Development would probably need a major re-capitalization if its creditors were to demand repayment.
See our latest analysis for Energy Development
We use two main ratios to inform us about debt levels relative to earnings. The first is net debt divided by earnings before interest, tax, depreciation, and amortization (EBITDA), while the second is how many times its earnings before interest and tax (EBIT) covers its interest expense (or its interest cover, for short). The advantage of this approach is that we take into account both the absolute quantum of debt (with net debt to EBITDA) and the actual interest expenses associated with that debt (with its interest cover ratio).
Weak interest cover of 1.0 times and a disturbingly high net debt to EBITDA ratio of 7.4 hit our confidence in Energy Development like a one-two punch to the gut. The debt burden here is substantial. On the other hand, Energy Development grew its EBIT by 27% in the last year. If sustained, this growth should make that debt evaporate like a scarce drinking water during an unnaturally hot summer. There's no doubt that we learn most about debt from the balance sheet. But it is Energy Development's earnings that will influence how the balance sheet holds up in the future. So when considering debt, it's definitely worth looking at the earnings trend. Click here for an interactive snapshot.
Finally, a business needs free cash flow to pay off debt; accounting profits just don't cut it. So it's worth checking how much of that EBIT is backed by free cash flow. Over the last three years, Energy Development actually produced more free cash flow than EBIT. There's nothing better than incoming cash when it comes to staying in your lenders' good graces.
Our View
While Energy Development's level of total liabilities has us nervous. To wit both its conversion of EBIT to free cash flow and EBIT growth rate were encouraging signs. It's also worth noting that Energy Development is in the Electric Utilities industry, which is often considered to be quite defensive. When we consider all the factors discussed, it seems to us that Energy Development is taking some risks with its use of debt. So while that leverage does boost returns on equity, we wouldn't really want to see it increase from here. When analysing debt levels, the balance sheet is the obvious place to start. But ultimately, every company can contain risks that exist outside of the balance sheet. For example, we've discovered 3 warning signs for Energy Development (1 is a bit unpleasant!) that you should be aware of before investing here.
When all is said and done, sometimes its easier to focus on companies that don't even need debt. Readers can access a list of growth stocks with zero net debt 100% free, right now.
The New Payments ETF Is Live on NASDAQ:
Money is moving to real-time rails, and a newly listed ETF now gives investors direct exposure. Fast settlement. Institutional custody. Simple access.
Explore how this launch could reshape portfolios
Sponsored ContentValuation is complex, but we're here to simplify it.
Discover if Energy Development might be undervalued or overvalued with our detailed analysis, featuring fair value estimates, potential risks, dividends, insider trades, and its financial condition.
Access Free AnalysisHave feedback on this article? Concerned about the content? Get in touch with us directly. Alternatively, email editorial-team (at) simplywallst.com.
This article by Simply Wall St is general in nature. We provide commentary based on historical data and analyst forecasts only using an unbiased methodology and our articles are not intended to be financial advice. It does not constitute a recommendation to buy or sell any stock, and does not take account of your objectives, or your financial situation. We aim to bring you long-term focused analysis driven by fundamental data. Note that our analysis may not factor in the latest price-sensitive company announcements or qualitative material. Simply Wall St has no position in any stocks mentioned.
About NSEI:ENERGYDEV
Energy Development
Generates and sells electricity from water and wind to various electricity boards in India.
Slight risk and slightly overvalued.
Market Insights

Weekly Picks

Early mover in a fast growing industry. Likely to experience share price volatility as they scale


A case for CA$31.80 (undiluted), aka 8,616% upside from CA$0.37 (an 86 bagger!).


Moderation and Stabilisation: HOLD: Fair Price based on a 4-year Cycle is $12.08
Recently Updated Narratives

Airbnb Stock: Platform Growth in a World of Saturation and Scrutiny

Adobe Stock: AI-Fueled ARR Growth Pushes Guidance Higher, But Cost Pressures Loom

Thomson Reuters Stock: When Legal Intelligence Becomes Mission-Critical Infrastructure
Popular Narratives


Crazy Undervalued 42 Baggers Silver Play (Active & Running Mine)


NVDA: Expanding AI Demand Will Drive Major Data Center Investments Through 2026

The AI Infrastructure Giant Grows Into Its Valuation
Trending Discussion


