- India
- /
- Gas Utilities
- /
- NSEI:ATGL
Do Fundamentals Have Any Role To Play In Driving Adani Total Gas Limited's (NSE:ATGL) Stock Up Recently?

Most readers would already know that Adani Total Gas' (NSE:ATGL) stock increased by 6.1% over the past three months. We wonder if and what role the company's financials play in that price change as a company's long-term fundamentals usually dictate market outcomes. In this article, we decided to focus on Adani Total Gas' ROE.
ROE or return on equity is a useful tool to assess how effectively a company can generate returns on the investment it received from its shareholders. In short, ROE shows the profit each dollar generates with respect to its shareholder investments.
How To Calculate Return On Equity?
The formula for ROE is:
Return on Equity = Net Profit (from continuing operations) ÷ Shareholders' Equity
So, based on the above formula, the ROE for Adani Total Gas is:
14% = ₹6.3b ÷ ₹45b (Based on the trailing twelve months to September 2025).
The 'return' is the profit over the last twelve months. One way to conceptualize this is that for each ₹1 of shareholders' capital it has, the company made ₹0.14 in profit.
See our latest analysis for Adani Total Gas
What Is The Relationship Between ROE And Earnings Growth?
Thus far, we have learned that ROE measures how efficiently a company is generating its profits. Based on how much of its profits the company chooses to reinvest or "retain", we are then able to evaluate a company's future ability to generate profits. Generally speaking, other things being equal, firms with a high return on equity and profit retention, have a higher growth rate than firms that don’t share these attributes.
A Side By Side comparison of Adani Total Gas' Earnings Growth And 14% ROE
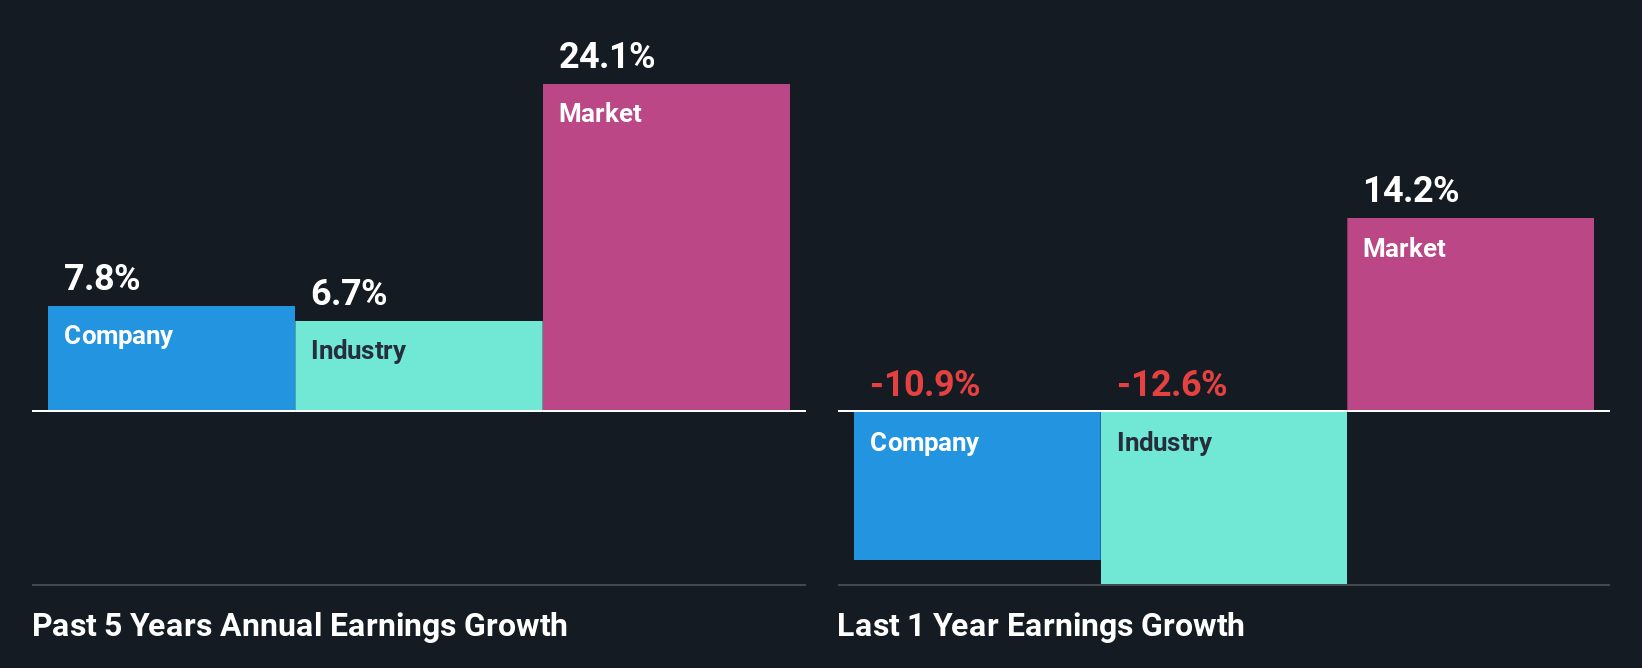
At first glance, Adani Total Gas' ROE doesn't look very promising. Yet, a closer study shows that the company's ROE is similar to the industry average of 14%. Having said that, Adani Total Gas has shown a modest net income growth of 7.8% over the past five years. Taking into consideration that the ROE is not particularly high, we reckon that there could also be other factors at play which could be influencing the company's growth. Such as - high earnings retention or an efficient management in place.
Next, on comparing Adani Total Gas' net income growth with the industry, we found that the company's reported growth is similar to the industry average growth rate of 6.7% over the last few years.
Earnings growth is a huge factor in stock valuation. It’s important for an investor to know whether the market has priced in the company's expected earnings growth (or decline). By doing so, they will have an idea if the stock is headed into clear blue waters or if swampy waters await. Is Adani Total Gas fairly valued compared to other companies? These 3 valuation measures might help you decide.
Is Adani Total Gas Making Efficient Use Of Its Profits?
Adani Total Gas' three-year median payout ratio to shareholders is 4.2% (implying that it retains 96% of its income), which is on the lower side, so it seems like the management is reinvesting profits heavily to grow its business.
Additionally, Adani Total Gas has paid dividends over a period of six years which means that the company is pretty serious about sharing its profits with shareholders.
Summary
On the whole, we do feel that Adani Total Gas has some positive attributes. Despite its low rate of return, the fact that the company reinvests a very high portion of its profits into its business, no doubt contributed to its high earnings growth. While we won't completely dismiss the company, what we would do, is try to ascertain how risky the business is to make a more informed decision around the company. To know the 1 risk we have identified for Adani Total Gas visit our risks dashboard for free.
The New Payments ETF Is Live on NASDAQ:
Money is moving to real-time rails, and a newly listed ETF now gives investors direct exposure. Fast settlement. Institutional custody. Simple access.
Explore how this launch could reshape portfolios
Sponsored ContentNew: Manage All Your Stock Portfolios in One Place
We've created the ultimate portfolio companion for stock investors, and it's free.
• Connect an unlimited number of Portfolios and see your total in one currency
• Be alerted to new Warning Signs or Risks via email or mobile
• Track the Fair Value of your stocks
Have feedback on this article? Concerned about the content? Get in touch with us directly. Alternatively, email editorial-team (at) simplywallst.com.
This article by Simply Wall St is general in nature. We provide commentary based on historical data and analyst forecasts only using an unbiased methodology and our articles are not intended to be financial advice. It does not constitute a recommendation to buy or sell any stock, and does not take account of your objectives, or your financial situation. We aim to bring you long-term focused analysis driven by fundamental data. Note that our analysis may not factor in the latest price-sensitive company announcements or qualitative material. Simply Wall St has no position in any stocks mentioned.
About NSEI:ATGL
Adani Total Gas
Engages in the city gas distribution (CGD) business in India.
Mediocre balance sheet with questionable track record.
Similar Companies
Market Insights

Weekly Picks

Early mover in a fast growing industry. Likely to experience share price volatility as they scale


A case for CA$31.80 (undiluted), aka 8,616% upside from CA$0.37 (an 86 bagger!).


Moderation and Stabilisation: HOLD: Fair Price based on a 4-year Cycle is $12.08
Recently Updated Narratives

Airbnb Stock: Platform Growth in a World of Saturation and Scrutiny

Adobe Stock: AI-Fueled ARR Growth Pushes Guidance Higher, But Cost Pressures Loom

Thomson Reuters Stock: When Legal Intelligence Becomes Mission-Critical Infrastructure
Popular Narratives


Crazy Undervalued 42 Baggers Silver Play (Active & Running Mine)


NVDA: Expanding AI Demand Will Drive Major Data Center Investments Through 2026

The AI Infrastructure Giant Grows Into Its Valuation
Trending Discussion


