Stock Analysis
- India
- /
- Telecom Services and Carriers
- /
- NSEI:INDUSTOWER
Indus Towers' (NSE:INDUSTOWER) Returns On Capital Are Heading Higher


To find a multi-bagger stock, what are the underlying trends we should look for in a business? Typically, we'll want to notice a trend of growing return on capital employed (ROCE) and alongside that, an expanding base of capital employed. This shows us that it's a compounding machine, able to continually reinvest its earnings back into the business and generate higher returns. So on that note, Indus Towers (NSE:INDUSTOWER) looks quite promising in regards to its trends of return on capital.
Understanding Return On Capital Employed (ROCE)
For those that aren't sure what ROCE is, it measures the amount of pre-tax profits a company can generate from the capital employed in its business. To calculate this metric for Indus Towers, this is the formula:
Return on Capital Employed = Earnings Before Interest and Tax (EBIT) ÷ (Total Assets - Current Liabilities)
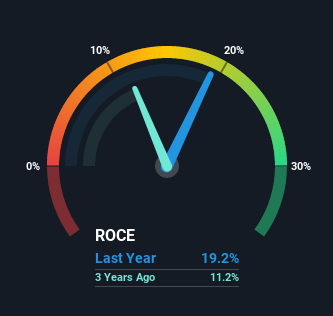
0.19 = ₹60b ÷ (₹449b - ₹140b) (Based on the trailing twelve months to June 2021).
Therefore, Indus Towers has an ROCE of 19%. In absolute terms, that's a satisfactory return, but compared to the Telecom industry average of 9.6% it's much better.
Check out our latest analysis for Indus Towers
Above you can see how the current ROCE for Indus Towers compares to its prior returns on capital, but there's only so much you can tell from the past. If you're interested, you can view the analysts predictions in our free report on analyst forecasts for the company.
The Trend Of ROCE
The trends we've noticed at Indus Towers are quite reassuring. Over the last five years, returns on capital employed have risen substantially to 19%. The amount of capital employed has increased too, by 61%. This can indicate that there's plenty of opportunities to invest capital internally and at ever higher rates, a combination that's common among multi-baggers.
For the record though, there was a noticeable increase in the company's current liabilities over the period, so we would attribute some of the ROCE growth to that. Essentially the business now has suppliers or short-term creditors funding about 31% of its operations, which isn't ideal. Keep an eye out for future increases because when the ratio of current liabilities to total assets gets particularly high, this can introduce some new risks for the business.
What We Can Learn From Indus Towers' ROCE
To sum it up, Indus Towers has proven it can reinvest in the business and generate higher returns on that capital employed, which is terrific. Given the stock has declined 16% in the last five years, this could be a good investment if the valuation and other metrics are also appealing. So researching this company further and determining whether or not these trends will continue seems justified.
Like most companies, Indus Towers does come with some risks, and we've found 4 warning signs that you should be aware of.
While Indus Towers isn't earning the highest return, check out this free list of companies that are earning high returns on equity with solid balance sheets.
If you decide to trade Indus Towers, use the lowest-cost* platform that is rated #1 Overall by Barron’s, Interactive Brokers. Trade stocks, options, futures, forex, bonds and funds on 135 markets, all from a single integrated account. Promoted
Valuation is complex, but we're helping make it simple.
Find out whether Indus Towers is potentially over or undervalued by checking out our comprehensive analysis, which includes fair value estimates, risks and warnings, dividends, insider transactions and financial health.
View the Free AnalysisThis article by Simply Wall St is general in nature. We provide commentary based on historical data and analyst forecasts only using an unbiased methodology and our articles are not intended to be financial advice. It does not constitute a recommendation to buy or sell any stock, and does not take account of your objectives, or your financial situation. We aim to bring you long-term focused analysis driven by fundamental data. Note that our analysis may not factor in the latest price-sensitive company announcements or qualitative material. Simply Wall St has no position in any stocks mentioned.
*Interactive Brokers Rated Lowest Cost Broker by StockBrokers.com Annual Online Review 2020
Have feedback on this article? Concerned about the content? Get in touch with us directly. Alternatively, email editorial-team (at) simplywallst.com.
About NSEI:INDUSTOWER
Indus Towers
Operates and maintains wireless communication towers and related infrastructures for various telecom service providers in India.
Outstanding track record with adequate balance sheet.
