Stock Analysis
- India
- /
- Telecom Services and Carriers
- /
- NSEI:INDUSTOWER
Does Indus Towers (NSE:INDUSTOWER) Have A Healthy Balance Sheet?


David Iben put it well when he said, 'Volatility is not a risk we care about. What we care about is avoiding the permanent loss of capital.' So it seems the smart money knows that debt - which is usually involved in bankruptcies - is a very important factor, when you assess how risky a company is. We can see that Indus Towers Limited (NSE:INDUSTOWER) does use debt in its business. But the more important question is: how much risk is that debt creating?
When Is Debt Dangerous?
Debt is a tool to help businesses grow, but if a business is incapable of paying off its lenders, then it exists at their mercy. Ultimately, if the company can't fulfill its legal obligations to repay debt, shareholders could walk away with nothing. However, a more usual (but still expensive) situation is where a company must dilute shareholders at a cheap share price simply to get debt under control. Of course, plenty of companies use debt to fund growth, without any negative consequences. When we examine debt levels, we first consider both cash and debt levels, together.
See our latest analysis for Indus Towers
How Much Debt Does Indus Towers Carry?
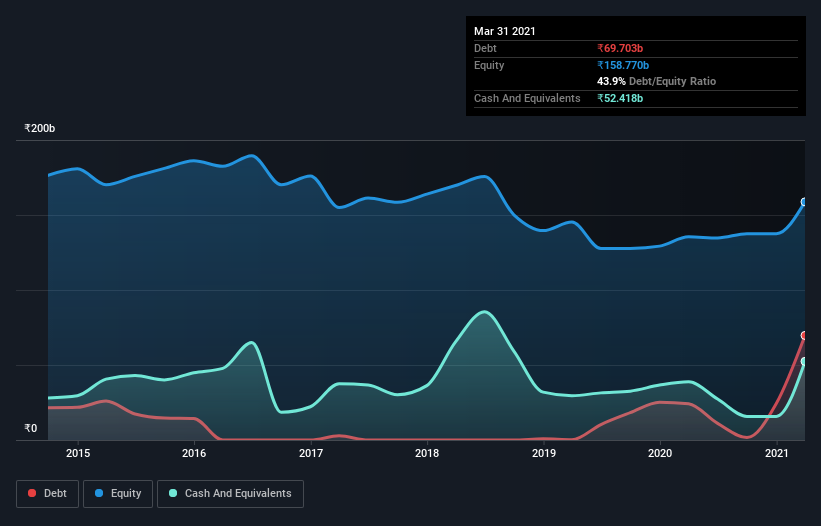
You can click the graphic below for the historical numbers, but it shows that as of March 2021 Indus Towers had ₹69.7b of debt, an increase on ₹24.2b, over one year. However, it also had ₹52.4b in cash, and so its net debt is ₹17.3b.
How Strong Is Indus Towers' Balance Sheet?
We can see from the most recent balance sheet that Indus Towers had liabilities of ₹139.5b falling due within a year, and liabilities of ₹151.2b due beyond that. Offsetting this, it had ₹52.4b in cash and ₹38.3b in receivables that were due within 12 months. So it has liabilities totalling ₹200.0b more than its cash and near-term receivables, combined.
Indus Towers has a market capitalization of ₹635.0b, so it could very likely raise cash to ameliorate its balance sheet, if the need arose. But it's clear that we should definitely closely examine whether it can manage its debt without dilution.
We measure a company's debt load relative to its earnings power by looking at its net debt divided by its earnings before interest, tax, depreciation, and amortization (EBITDA) and by calculating how easily its earnings before interest and tax (EBIT) cover its interest expense (interest cover). Thus we consider debt relative to earnings both with and without depreciation and amortization expenses.
While Indus Towers's low debt to EBITDA ratio of 0.24 suggests only modest use of debt, the fact that EBIT only covered the interest expense by 6.9 times last year does give us pause. So we'd recommend keeping a close eye on the impact financing costs are having on the business. On top of that, Indus Towers grew its EBIT by 89% over the last twelve months, and that growth will make it easier to handle its debt. When analysing debt levels, the balance sheet is the obvious place to start. But ultimately the future profitability of the business will decide if Indus Towers can strengthen its balance sheet over time. So if you're focused on the future you can check out this free report showing analyst profit forecasts.
Finally, while the tax-man may adore accounting profits, lenders only accept cold hard cash. So the logical step is to look at the proportion of that EBIT that is matched by actual free cash flow. Over the last three years, Indus Towers actually produced more free cash flow than EBIT. There's nothing better than incoming cash when it comes to staying in your lenders' good graces.
Our View
Indus Towers's conversion of EBIT to free cash flow suggests it can handle its debt as easily as Cristiano Ronaldo could score a goal against an under 14's goalkeeper. And the good news does not stop there, as its EBIT growth rate also supports that impression! Looking at the bigger picture, we think Indus Towers's use of debt seems quite reasonable and we're not concerned about it. While debt does bring risk, when used wisely it can also bring a higher return on equity. The balance sheet is clearly the area to focus on when you are analysing debt. But ultimately, every company can contain risks that exist outside of the balance sheet. To that end, you should learn about the 4 warning signs we've spotted with Indus Towers (including 1 which is significant) .
When all is said and done, sometimes its easier to focus on companies that don't even need debt. Readers can access a list of growth stocks with zero net debt 100% free, right now.
If you’re looking to trade Indus Towers, open an account with the lowest-cost* platform trusted by professionals, Interactive Brokers. Their clients from over 200 countries and territories trade stocks, options, futures, forex, bonds and funds worldwide from a single integrated account. Promoted
Valuation is complex, but we're helping make it simple.
Find out whether Indus Towers is potentially over or undervalued by checking out our comprehensive analysis, which includes fair value estimates, risks and warnings, dividends, insider transactions and financial health.
View the Free AnalysisThis article by Simply Wall St is general in nature. It does not constitute a recommendation to buy or sell any stock, and does not take account of your objectives, or your financial situation. We aim to bring you long-term focused analysis driven by fundamental data. Note that our analysis may not factor in the latest price-sensitive company announcements or qualitative material. Simply Wall St has no position in any stocks mentioned.
*Interactive Brokers Rated Lowest Cost Broker by StockBrokers.com Annual Online Review 2020
Have feedback on this article? Concerned about the content? Get in touch with us directly. Alternatively, email editorial-team (at) simplywallst.com.
About NSEI:INDUSTOWER
Indus Towers
Operates and maintains wireless communication towers and related infrastructures for various telecom service providers in India.
Outstanding track record with adequate balance sheet.
